
CFA考試相關(guān)視頻
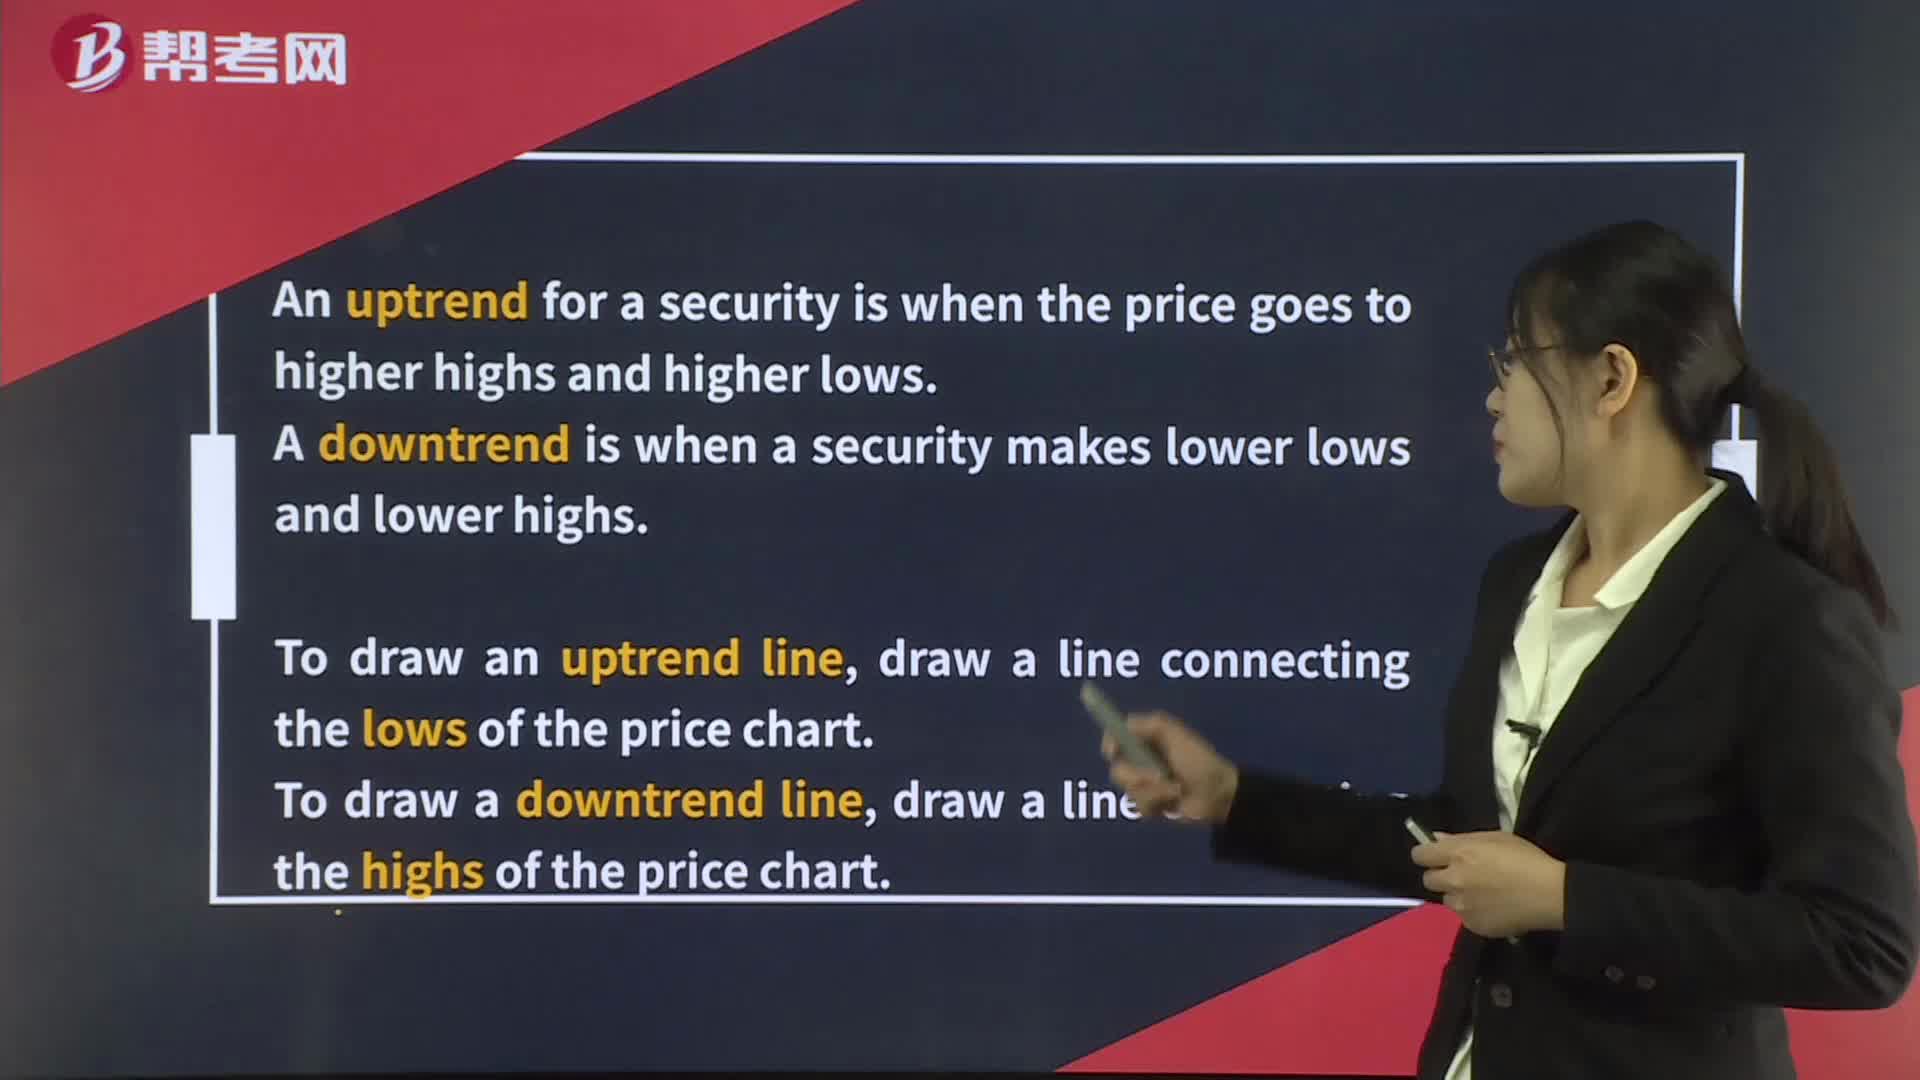
Technical Analysis Tools— Technical Indicators

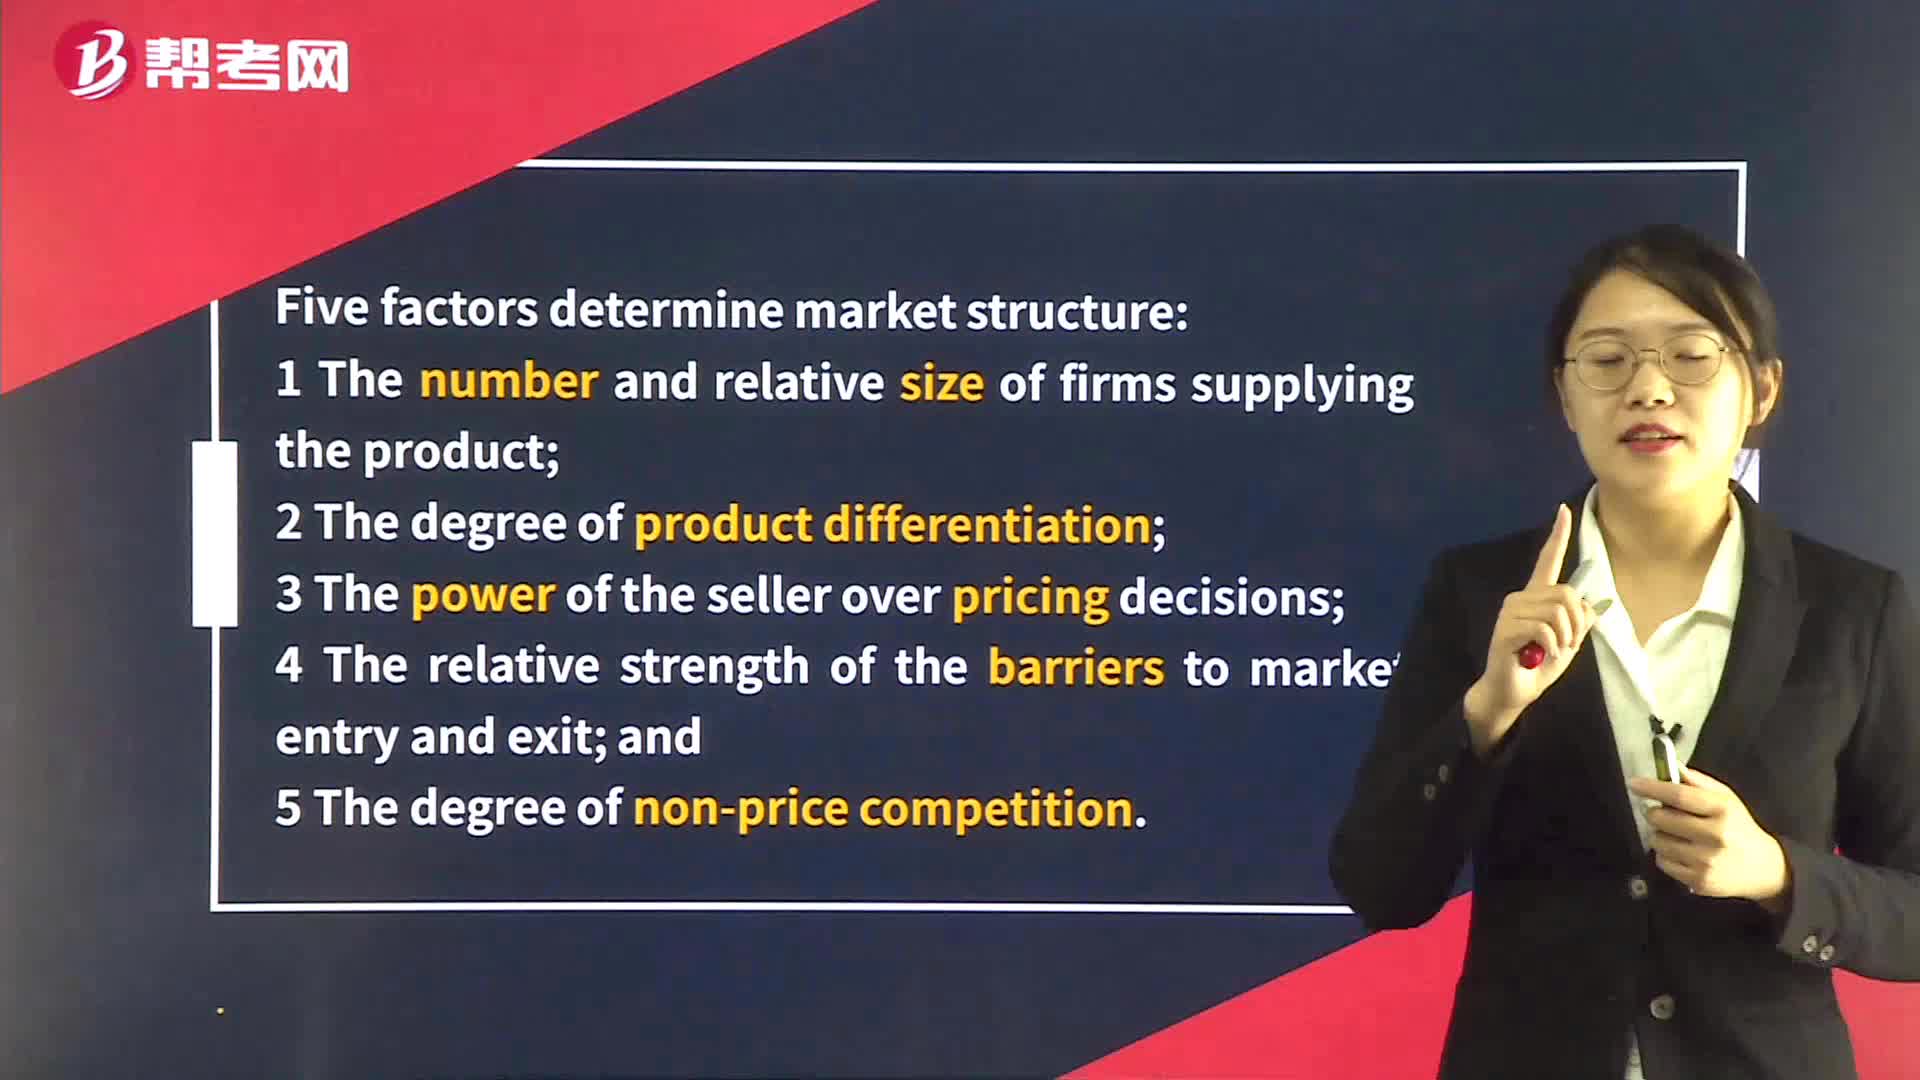
Demand Analysis in Perfect Competition
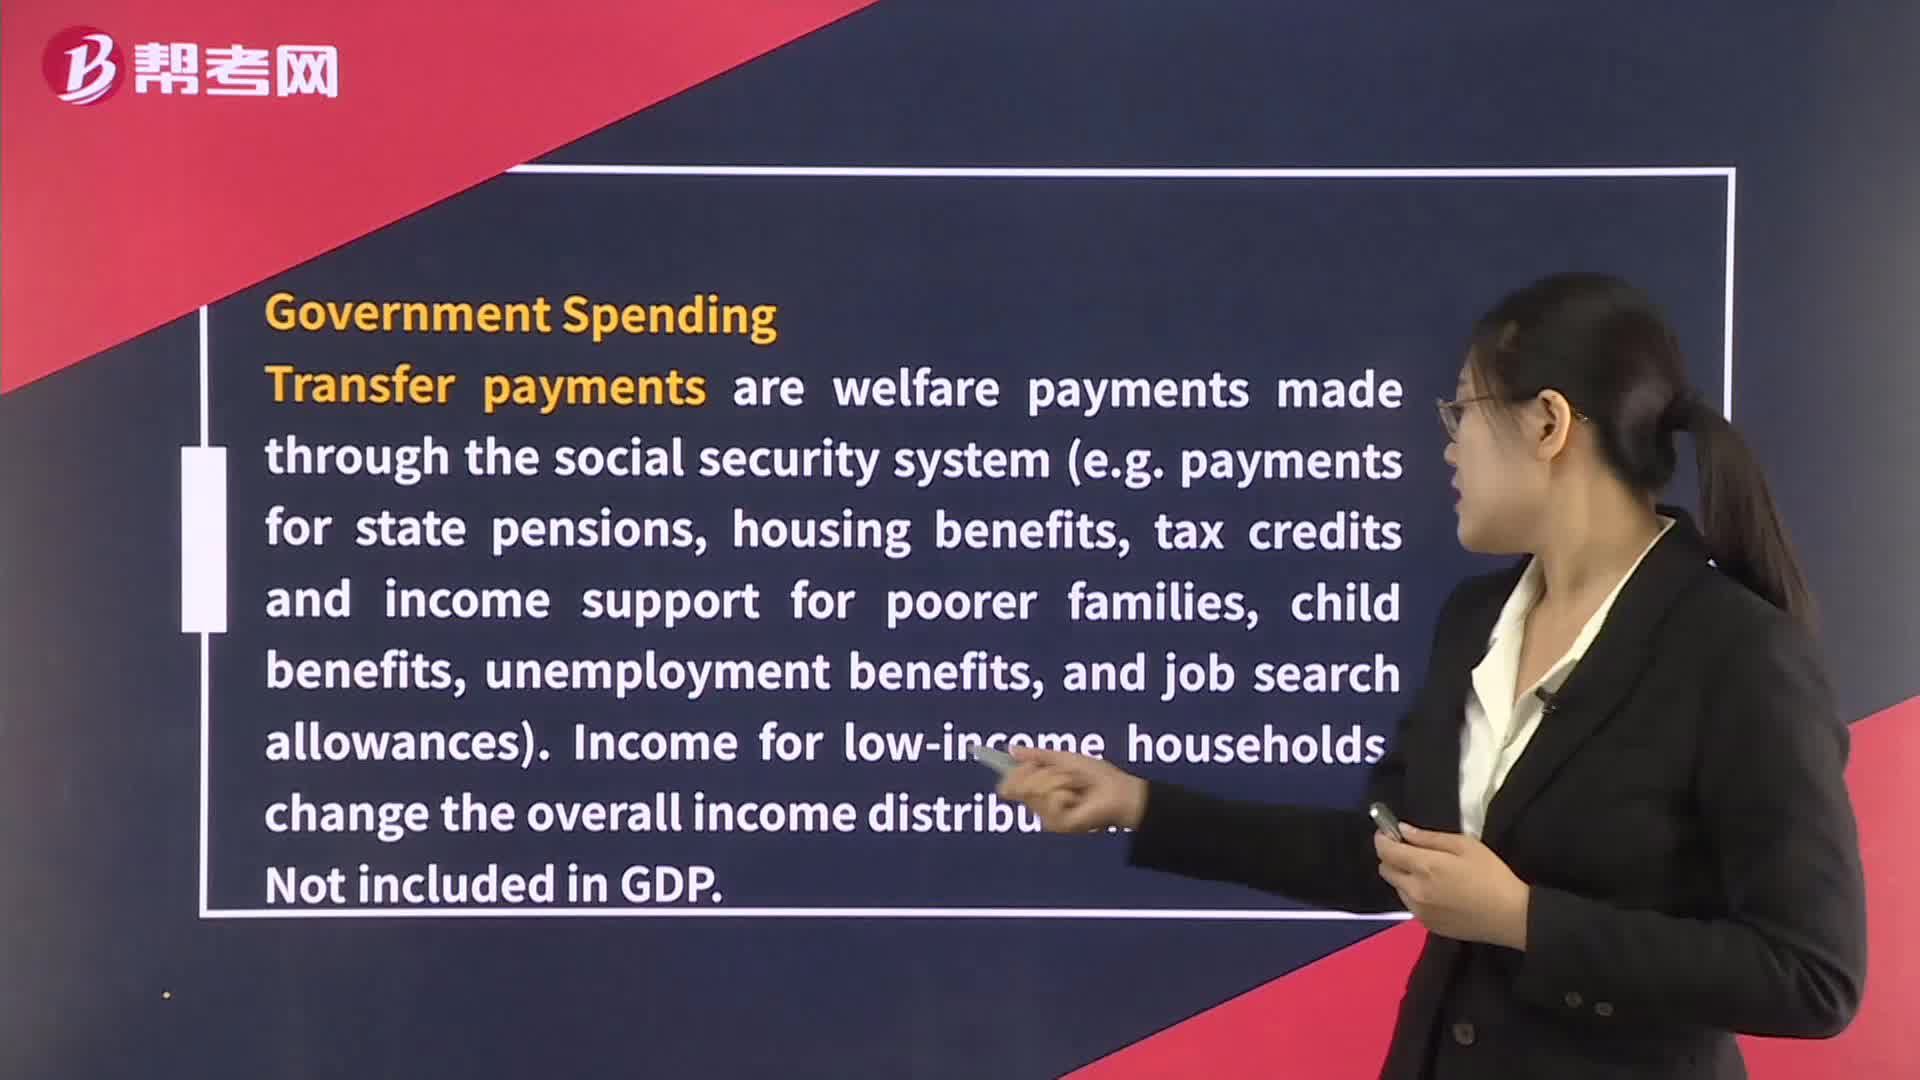
The Advantages and Disadvantages of Using the Different Tools of Fiscal Policy
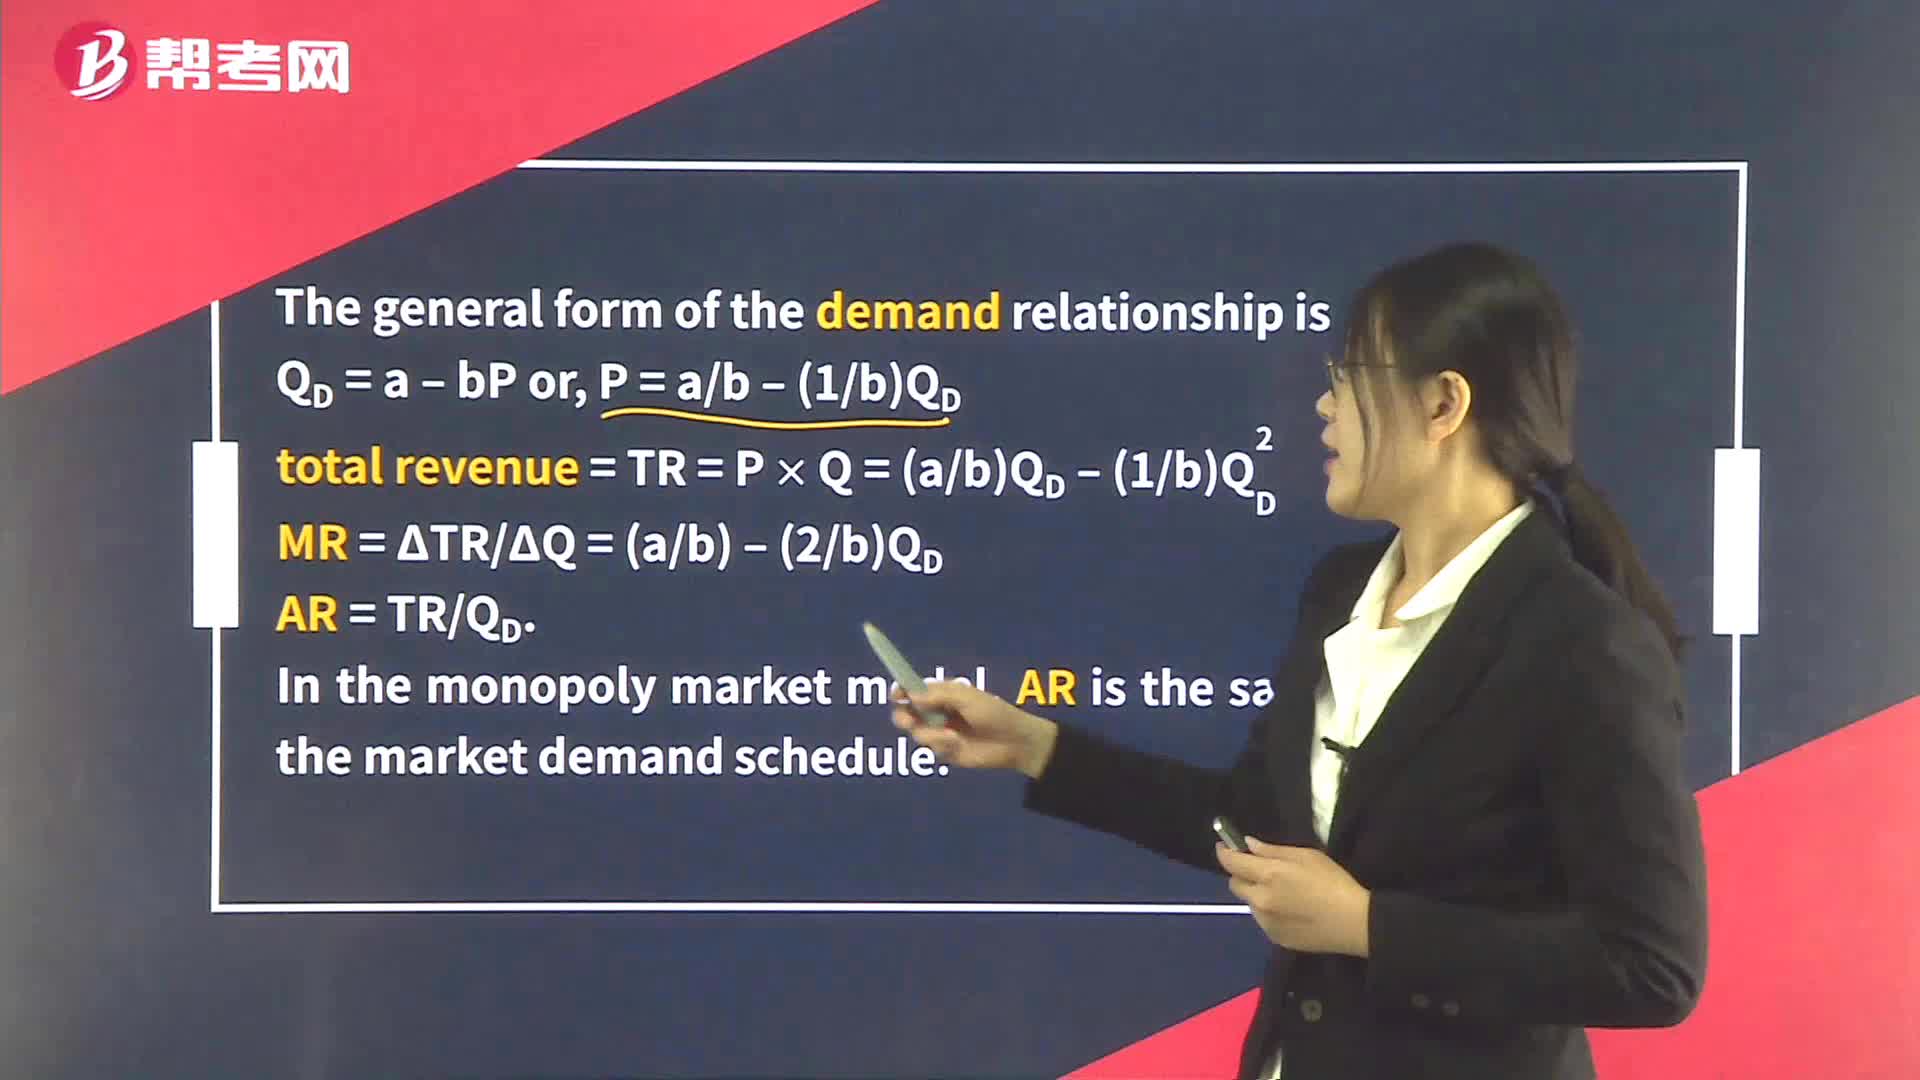
Demand Analysis in Monopoly

Popular Economic Indicators – Coincident
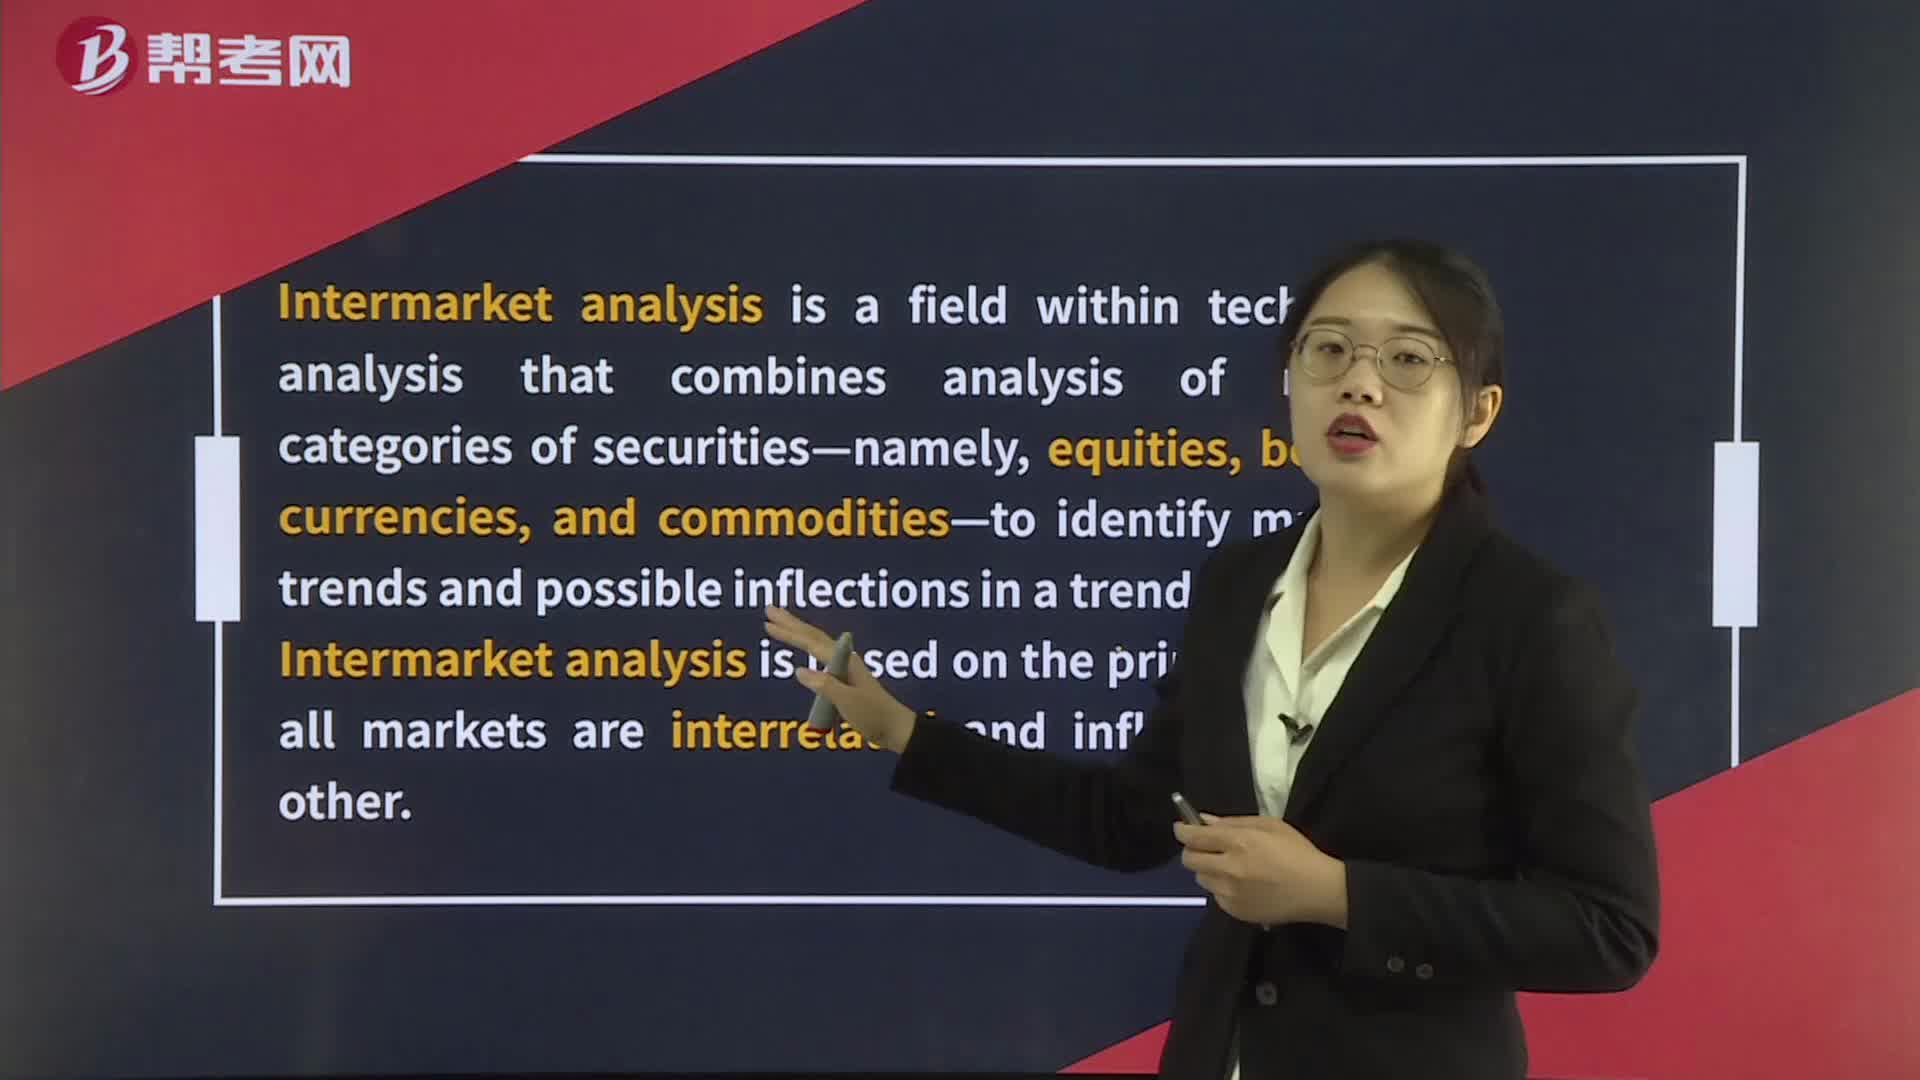
Intermarket analysis
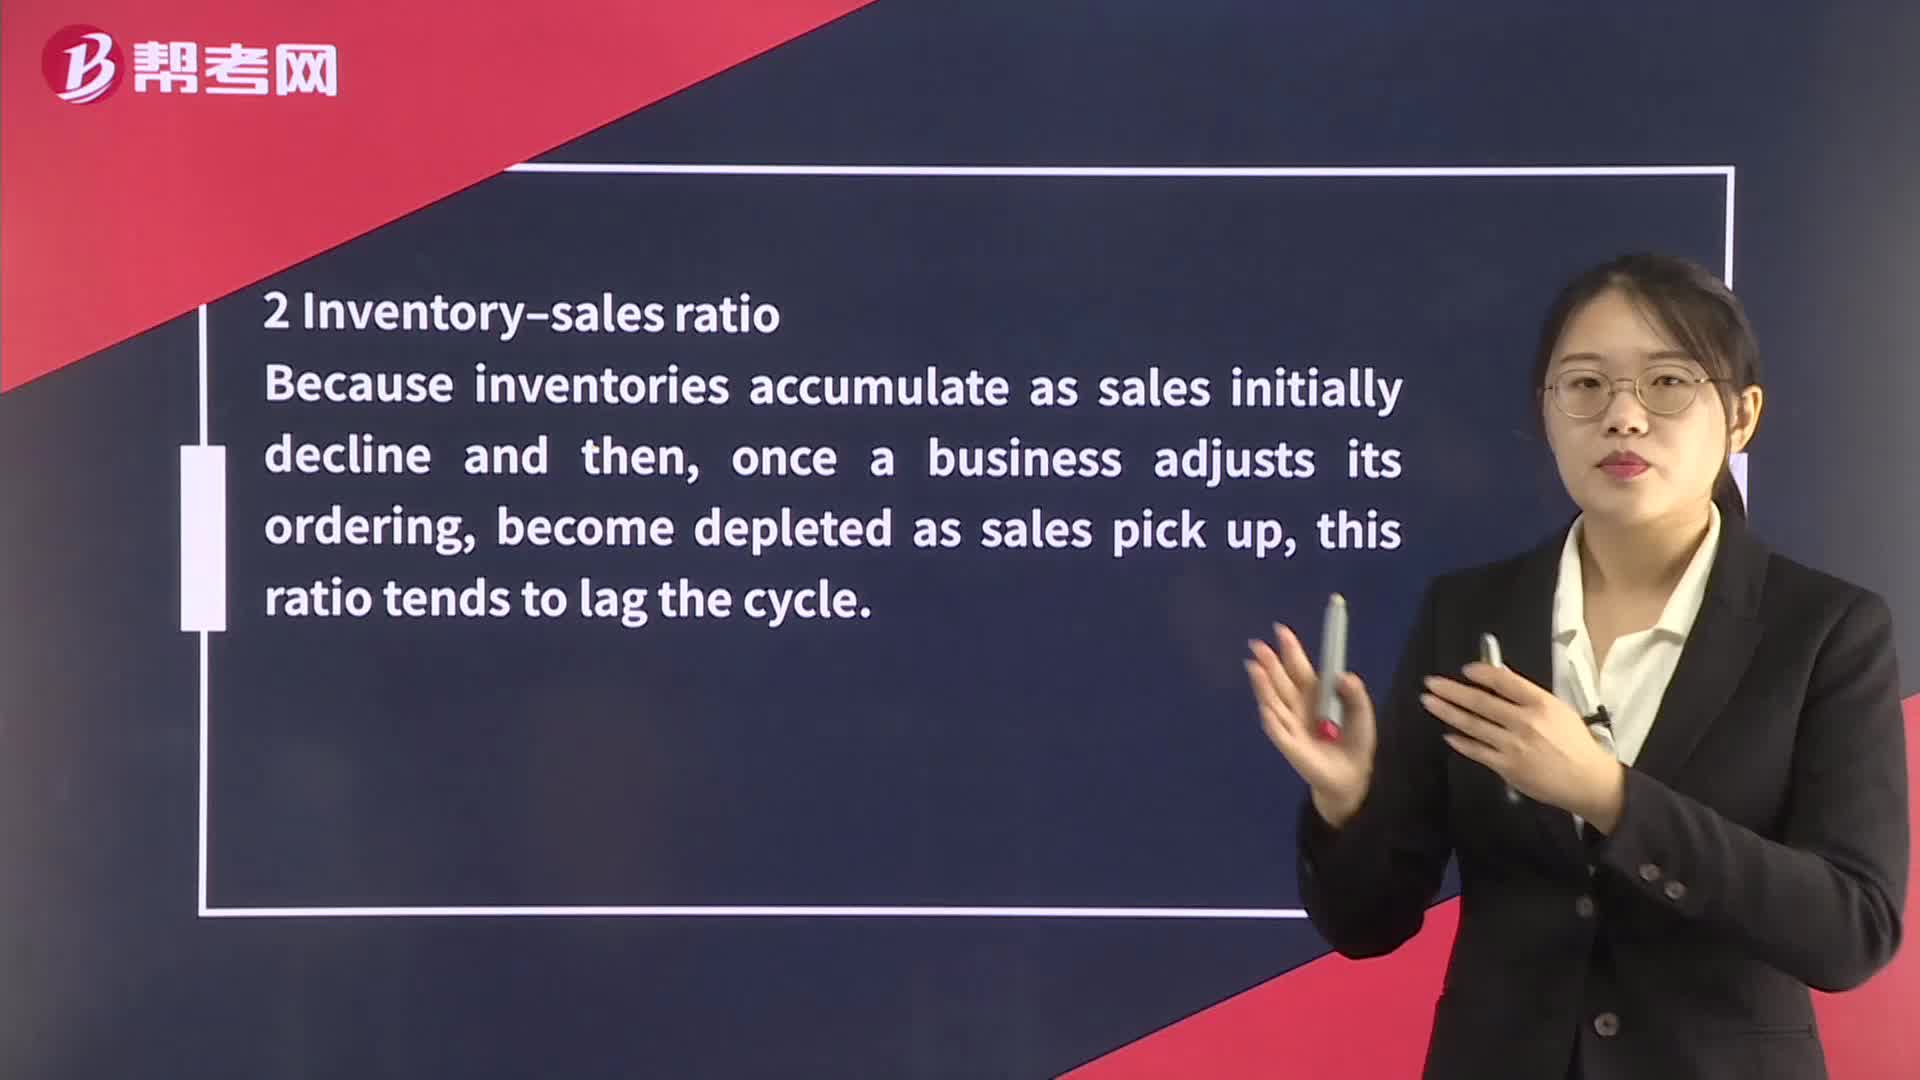
Popular Economic Indicators – Lagging
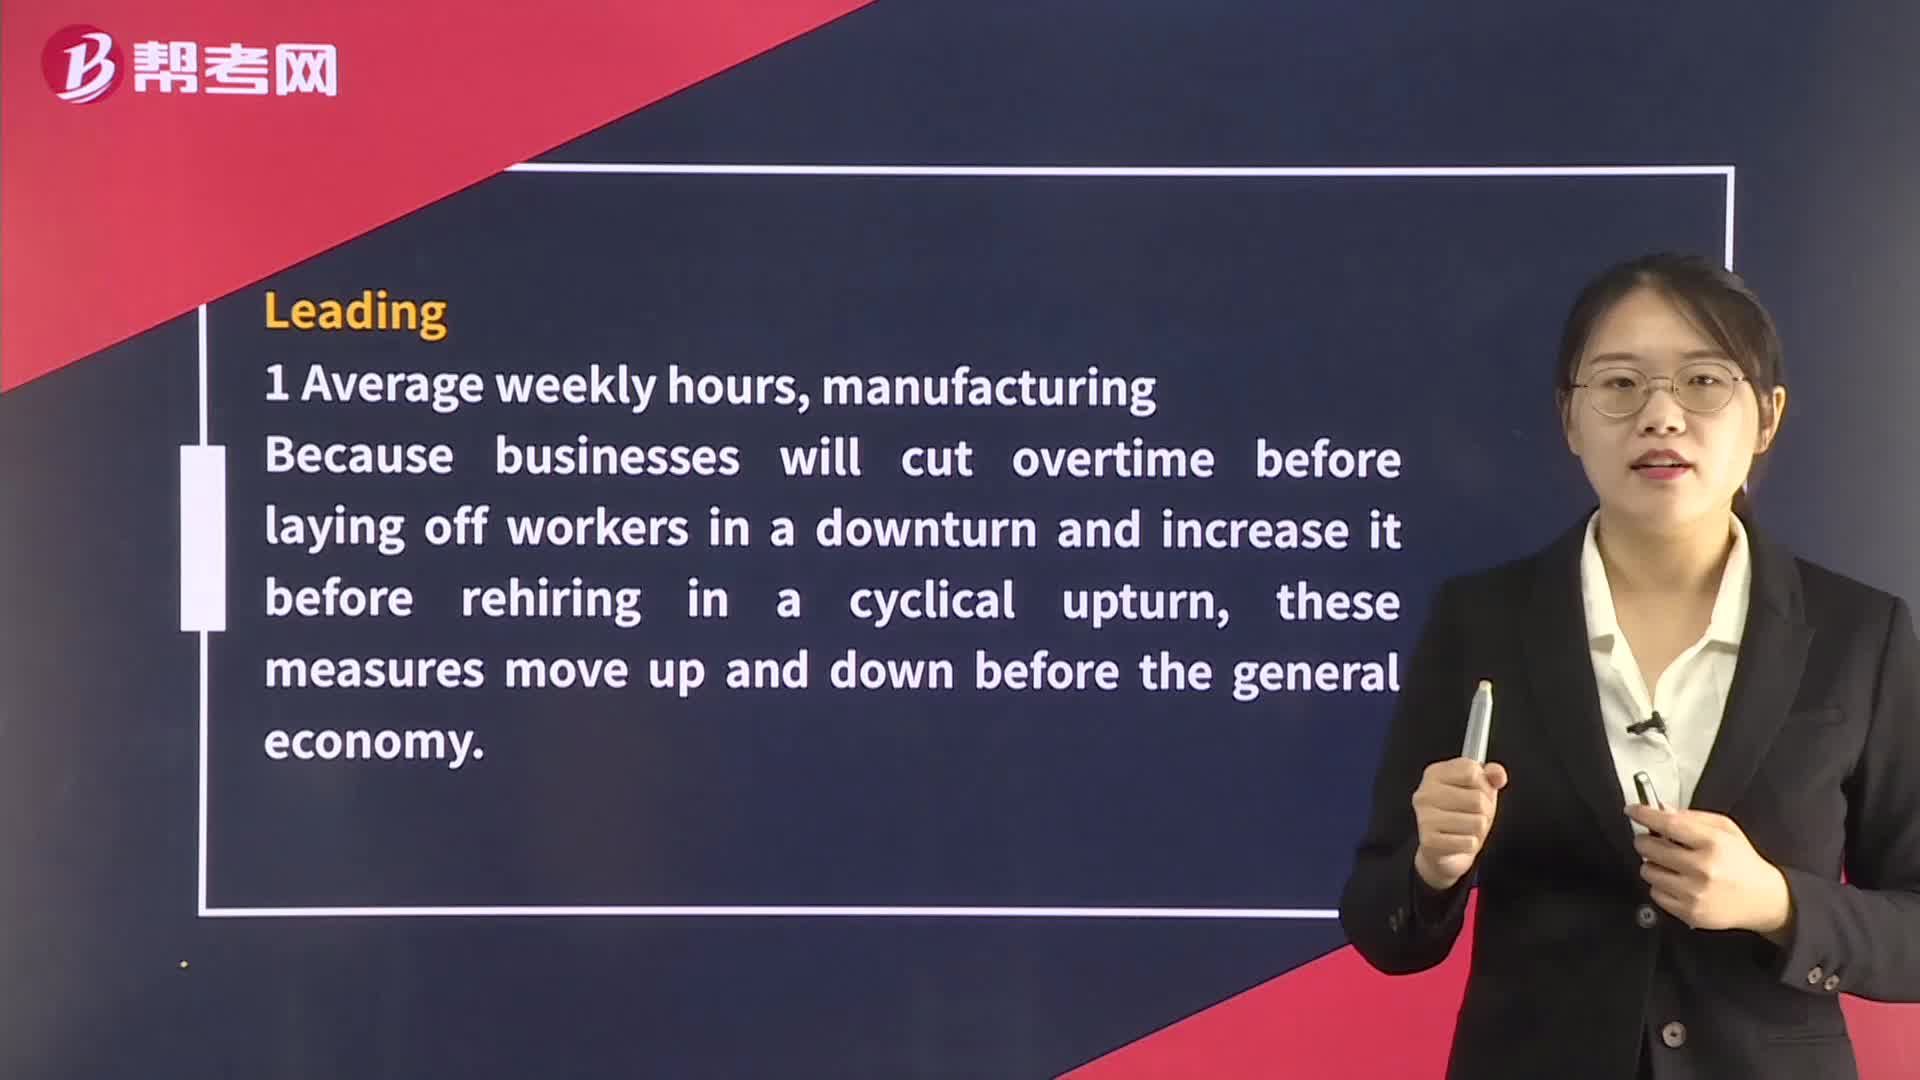
Popular Economic Indicators – Leading
Technical Analysis Tools— Cycles
Other Variables Used as Economic Indicators
Overall Payroll Employment and Productivity Indicators
Monetary Policy Tools