
CFA考試相關(guān)視頻
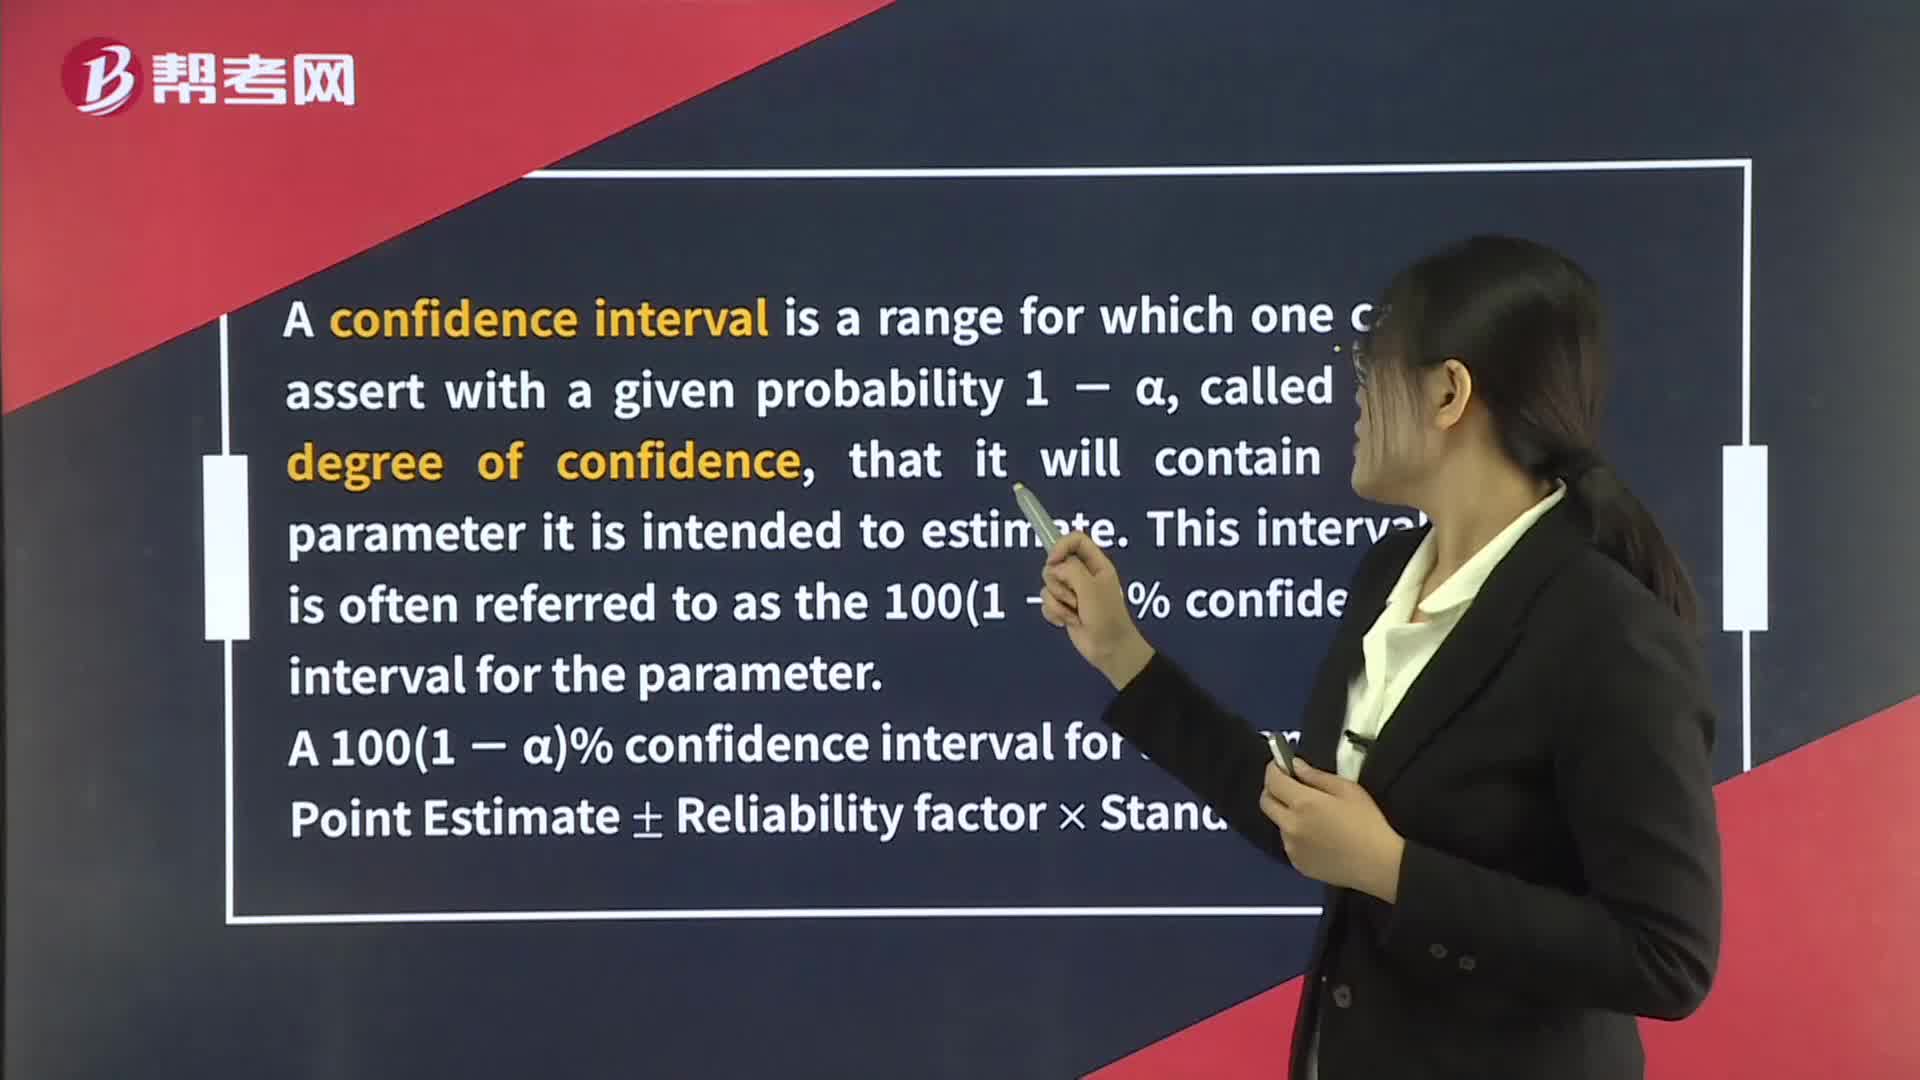
Confidence Intervals for the Population Mean
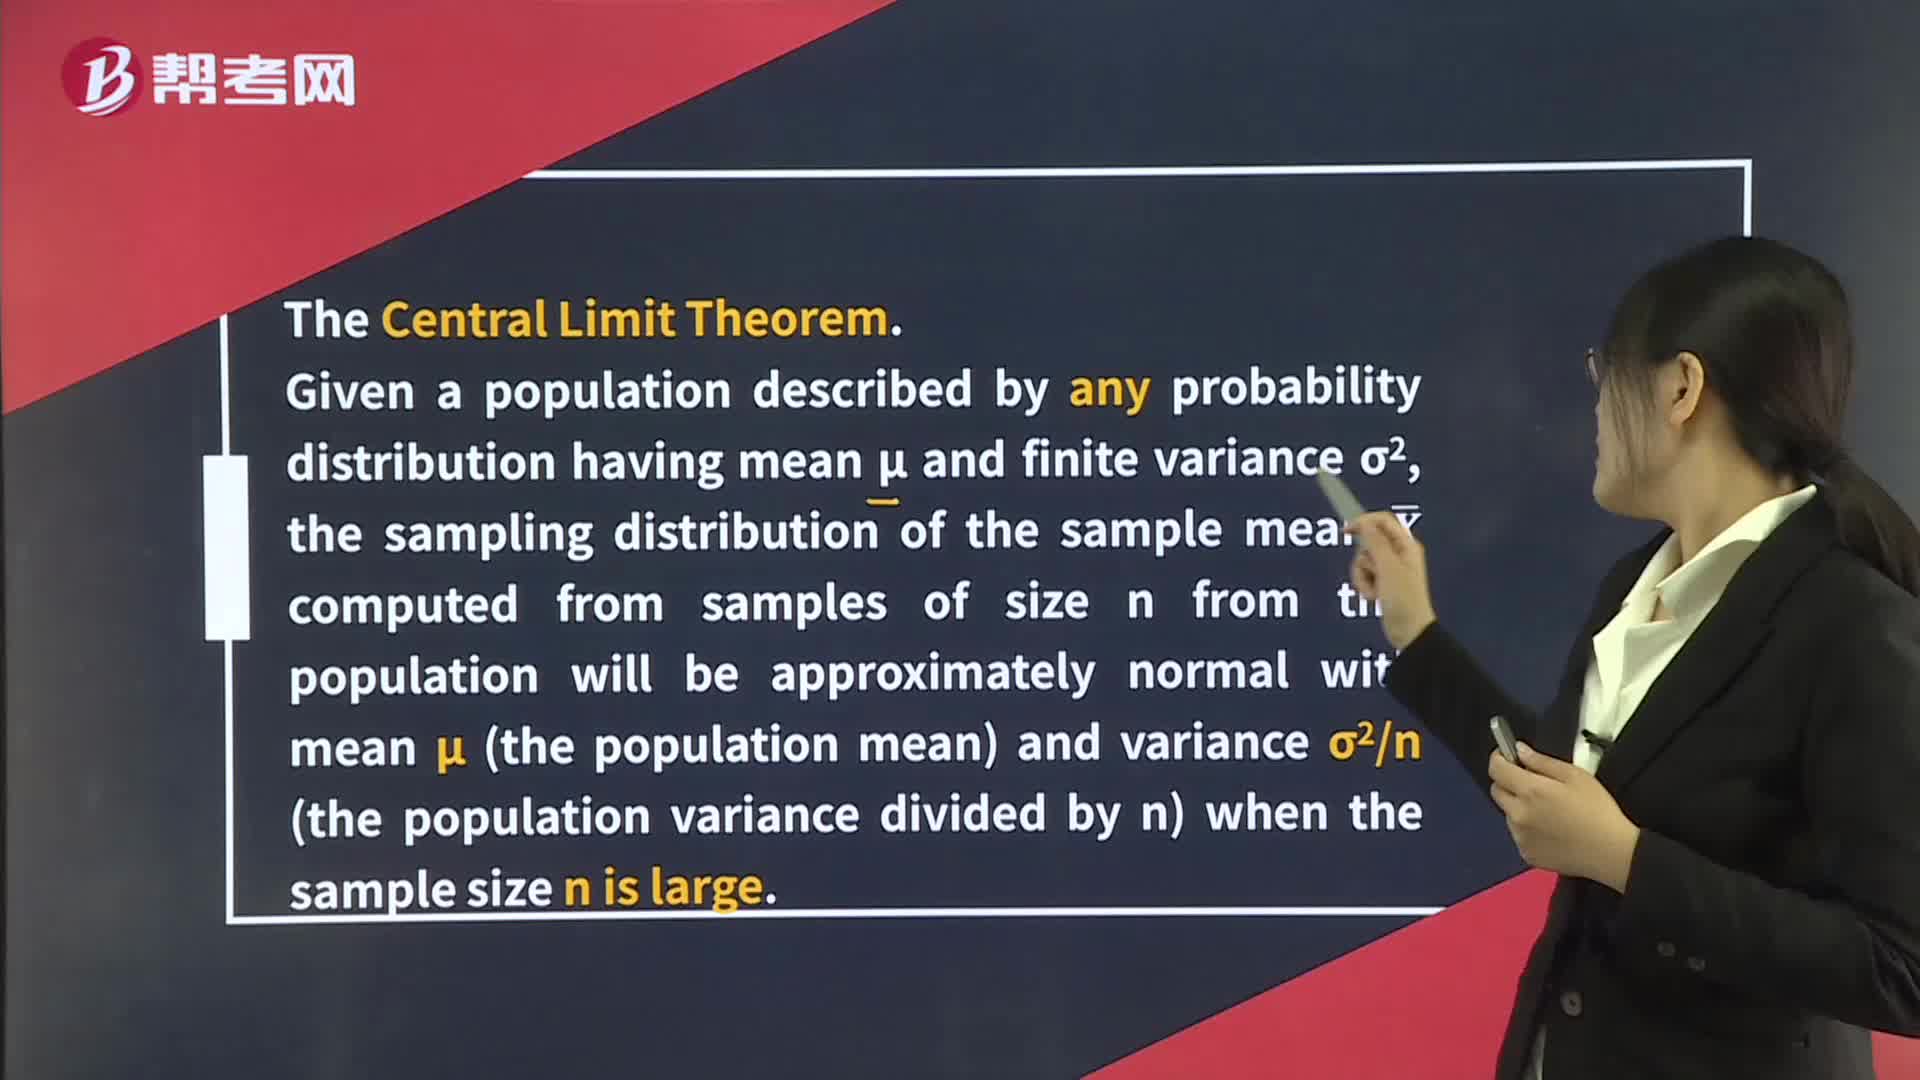
Distribution of the Sample Mean
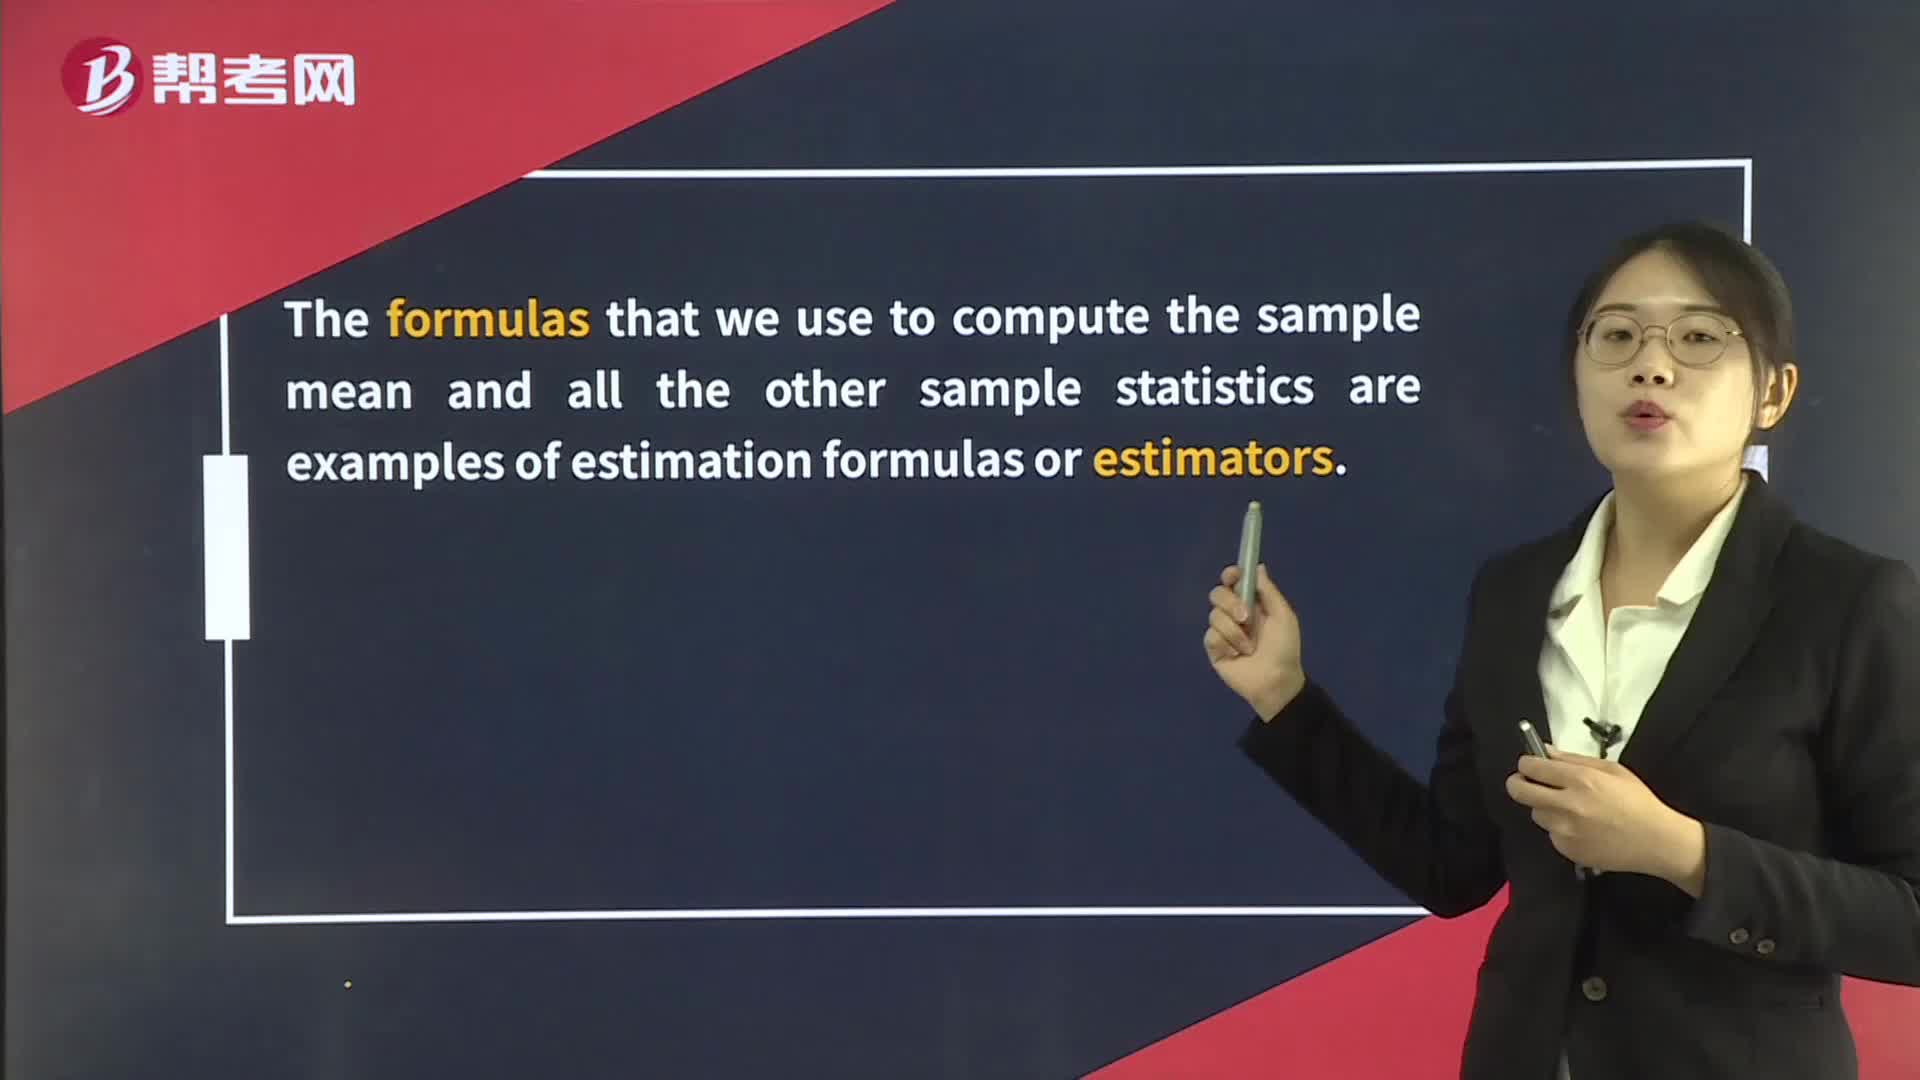
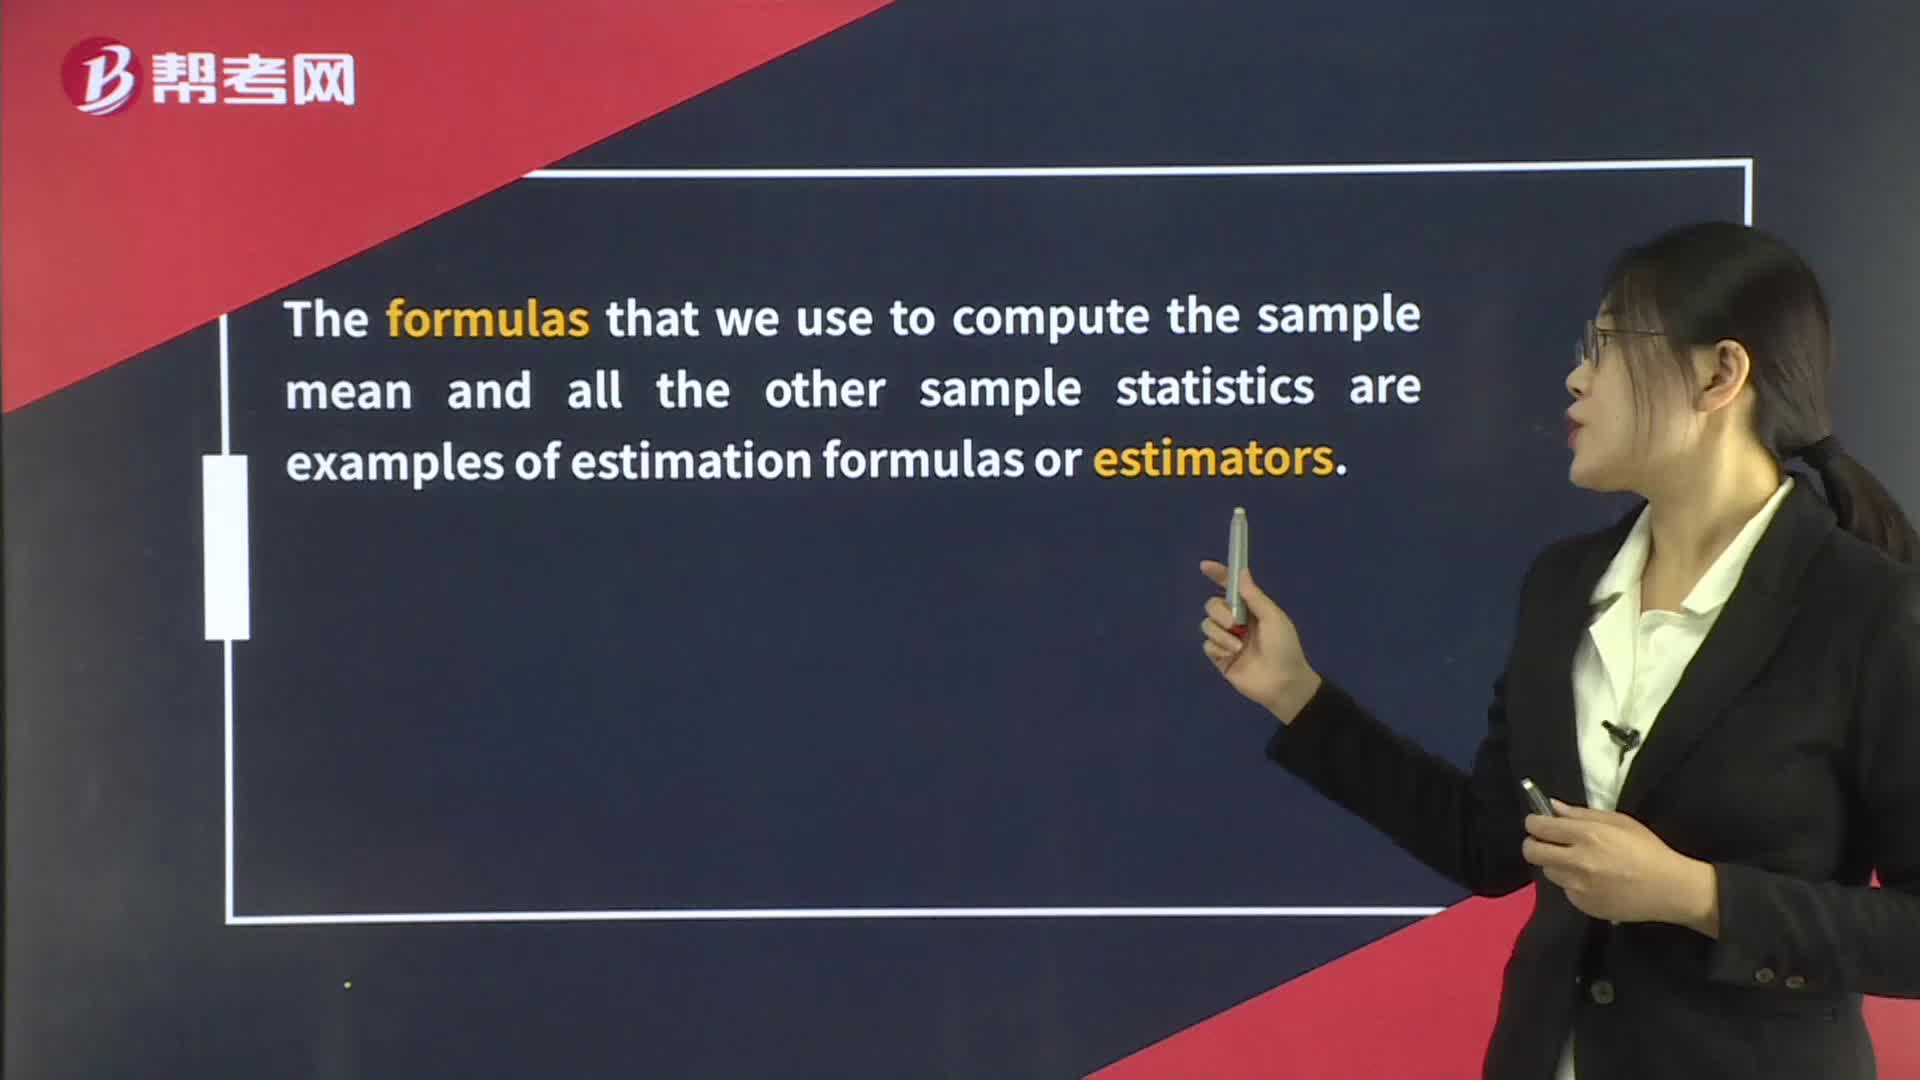
Point and Interval Estimates of the Population Mean
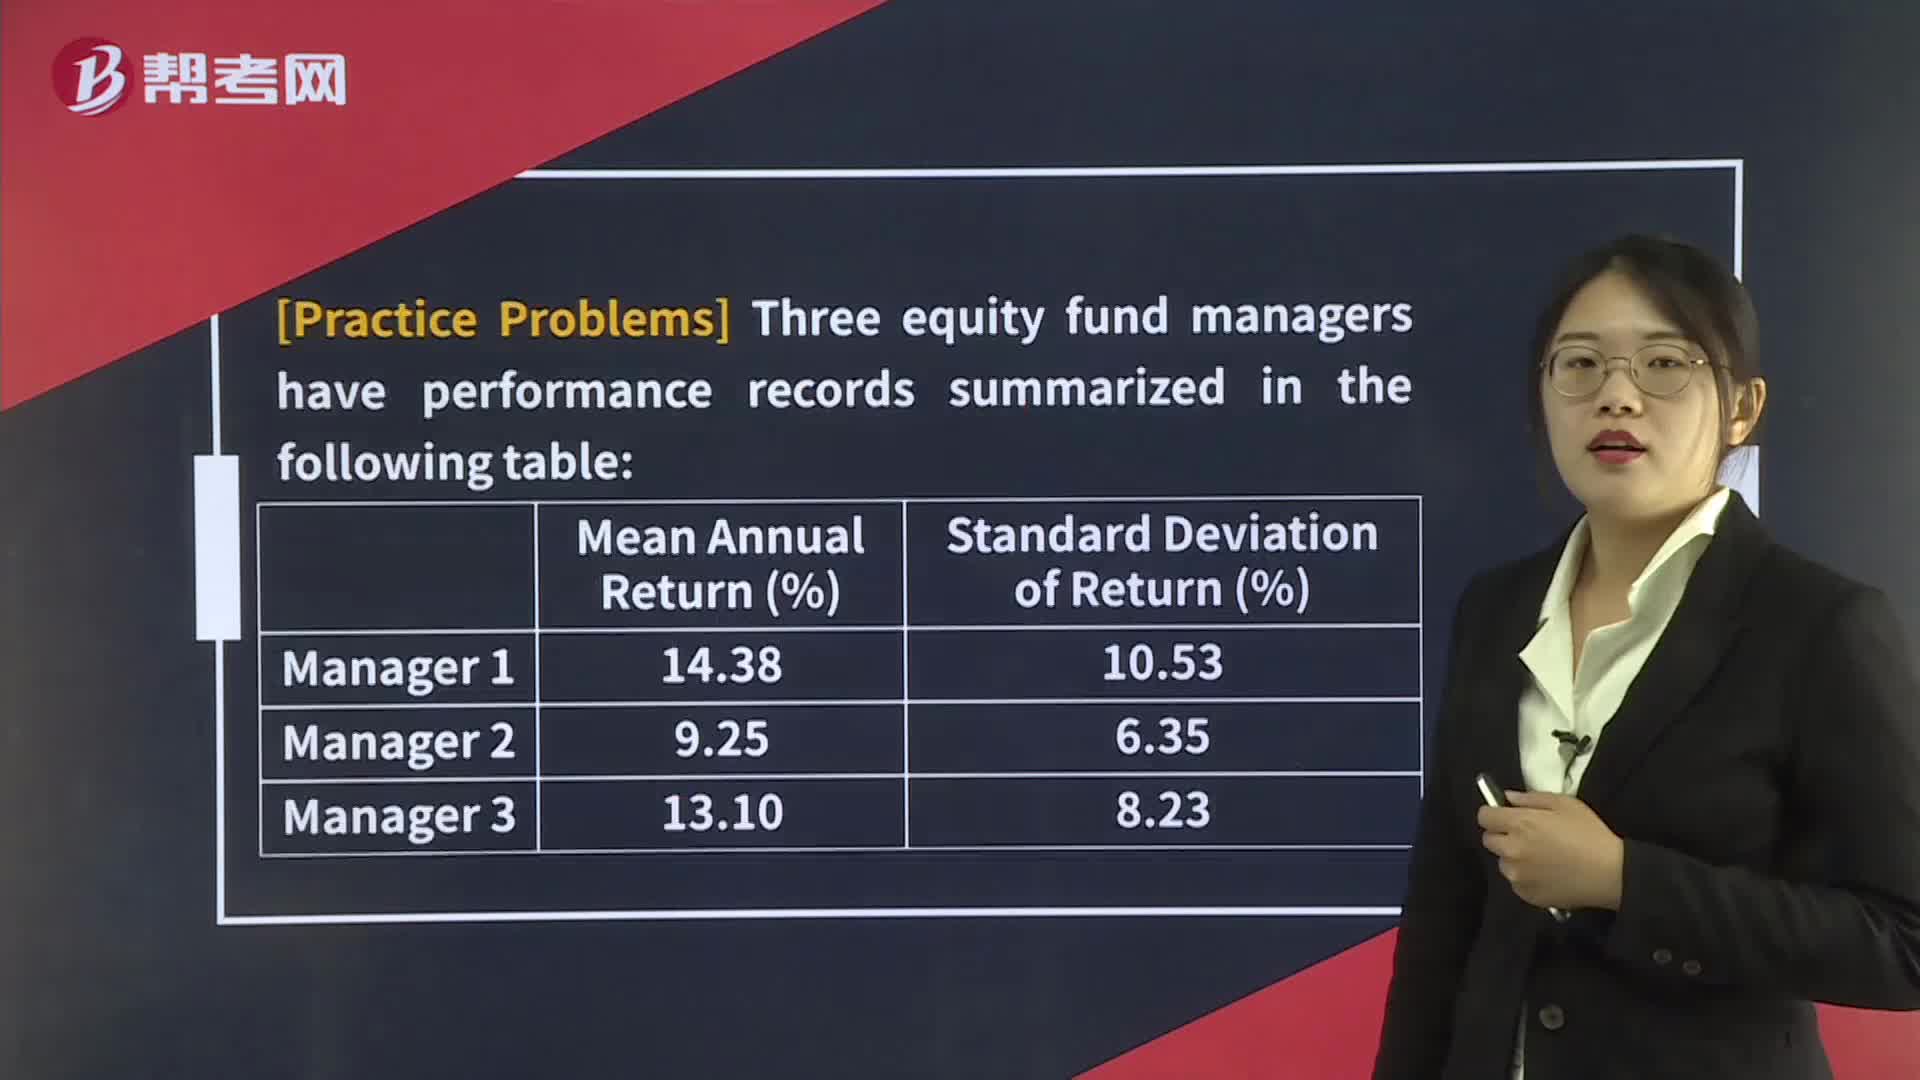
The Sharpe Ratio
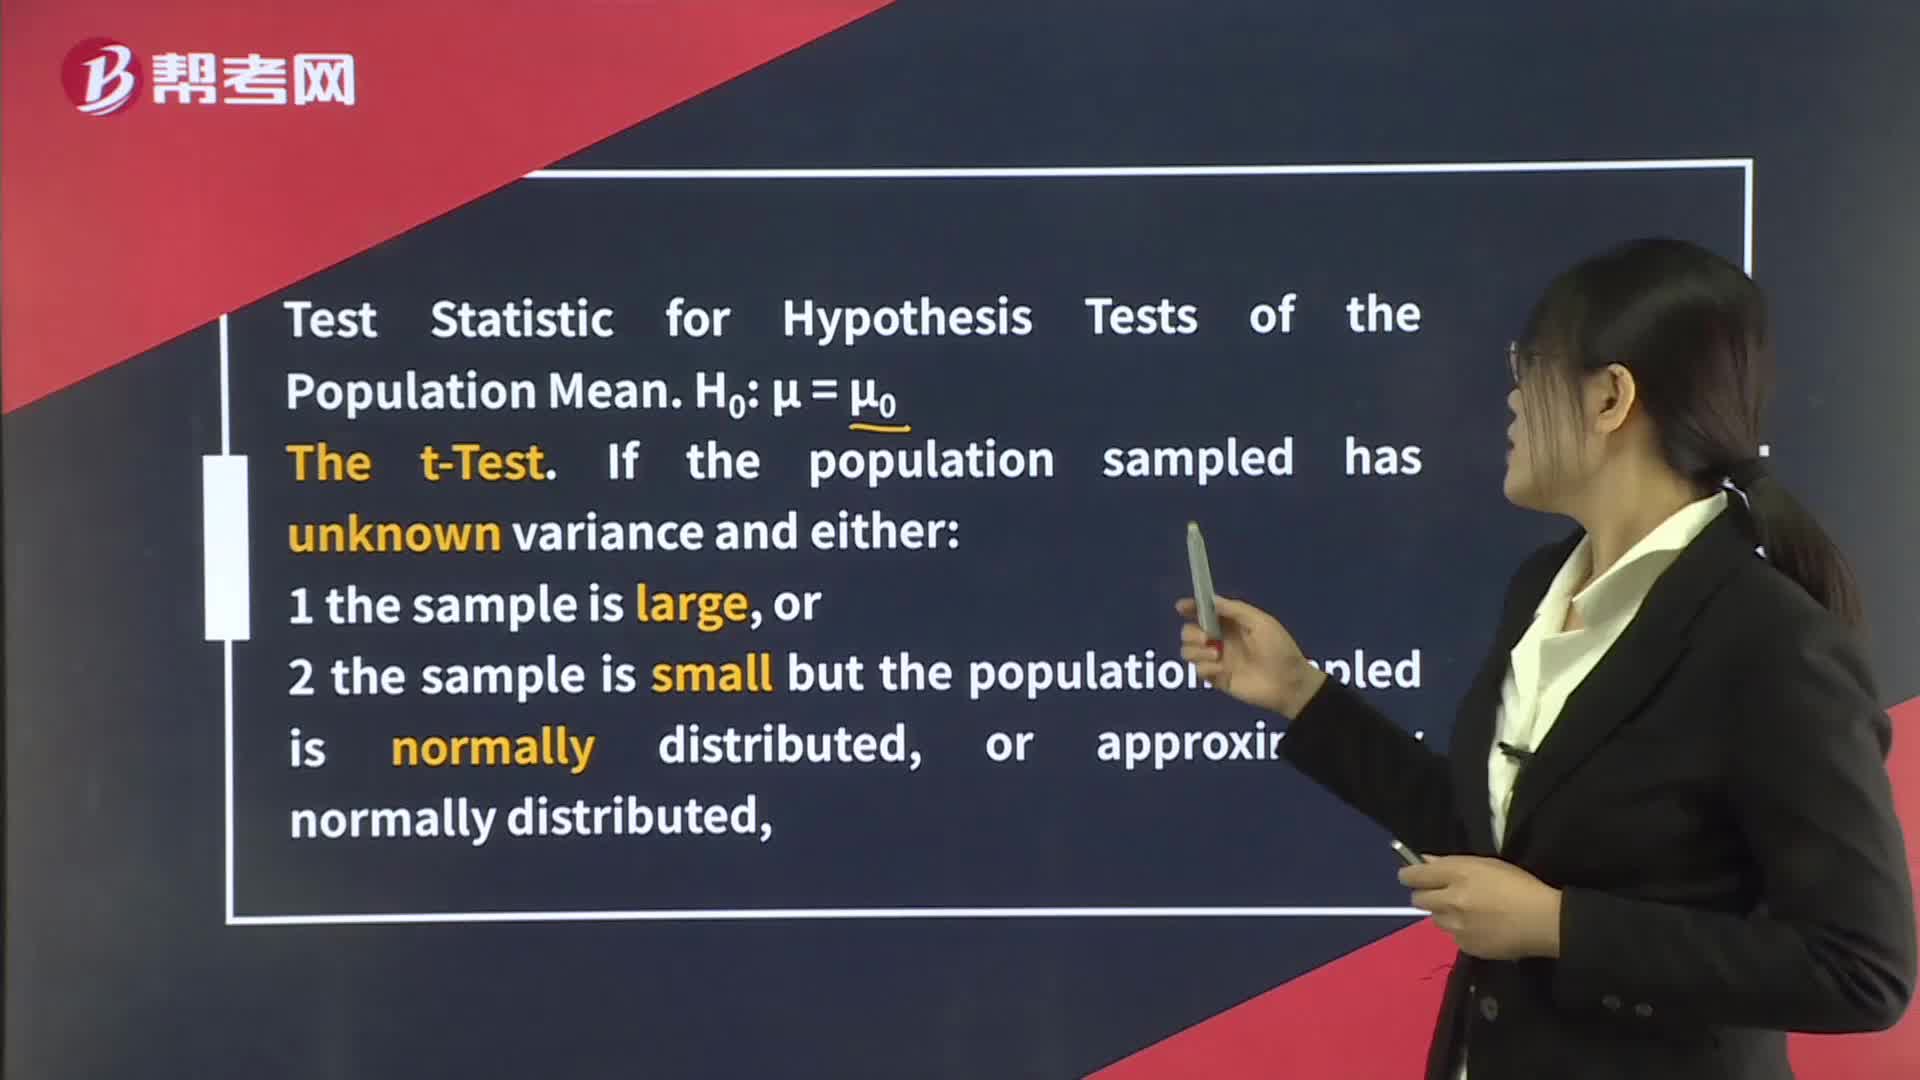
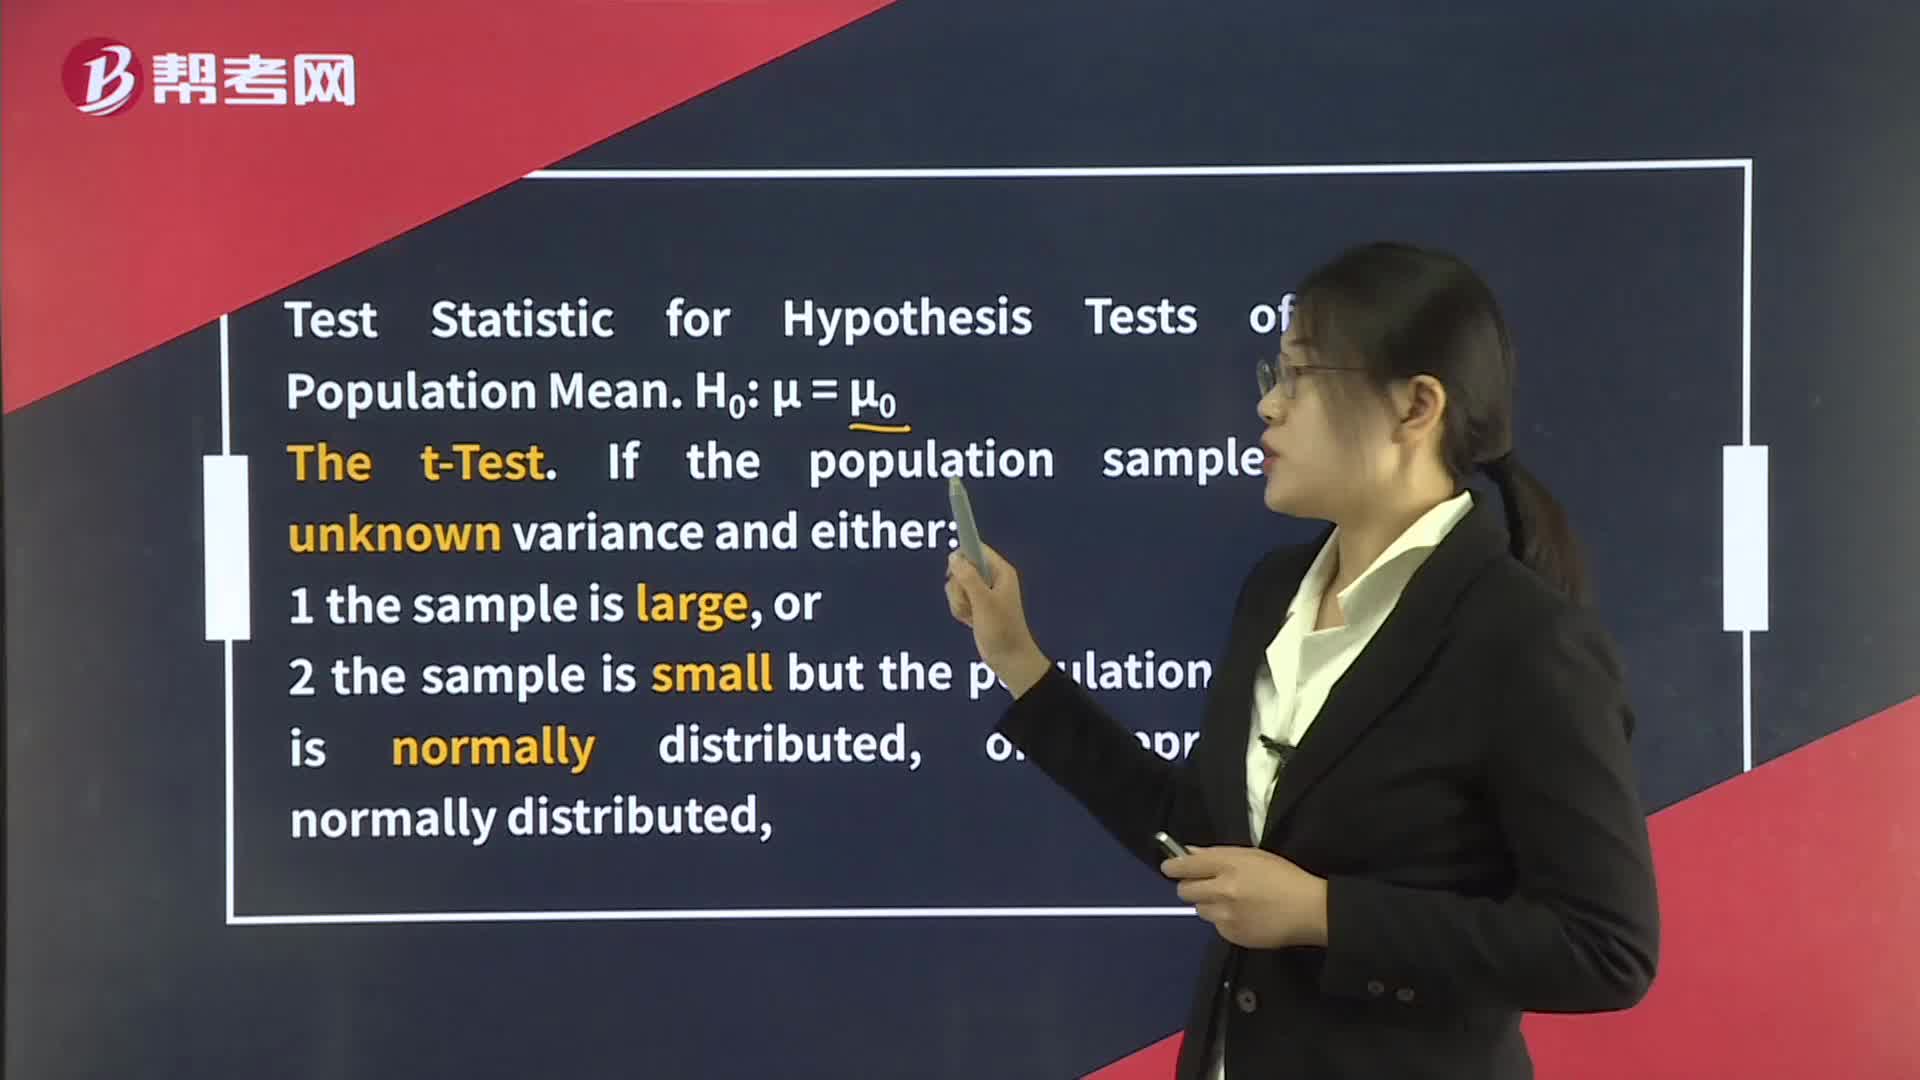
Hypothesis Tests Concerning the Mean
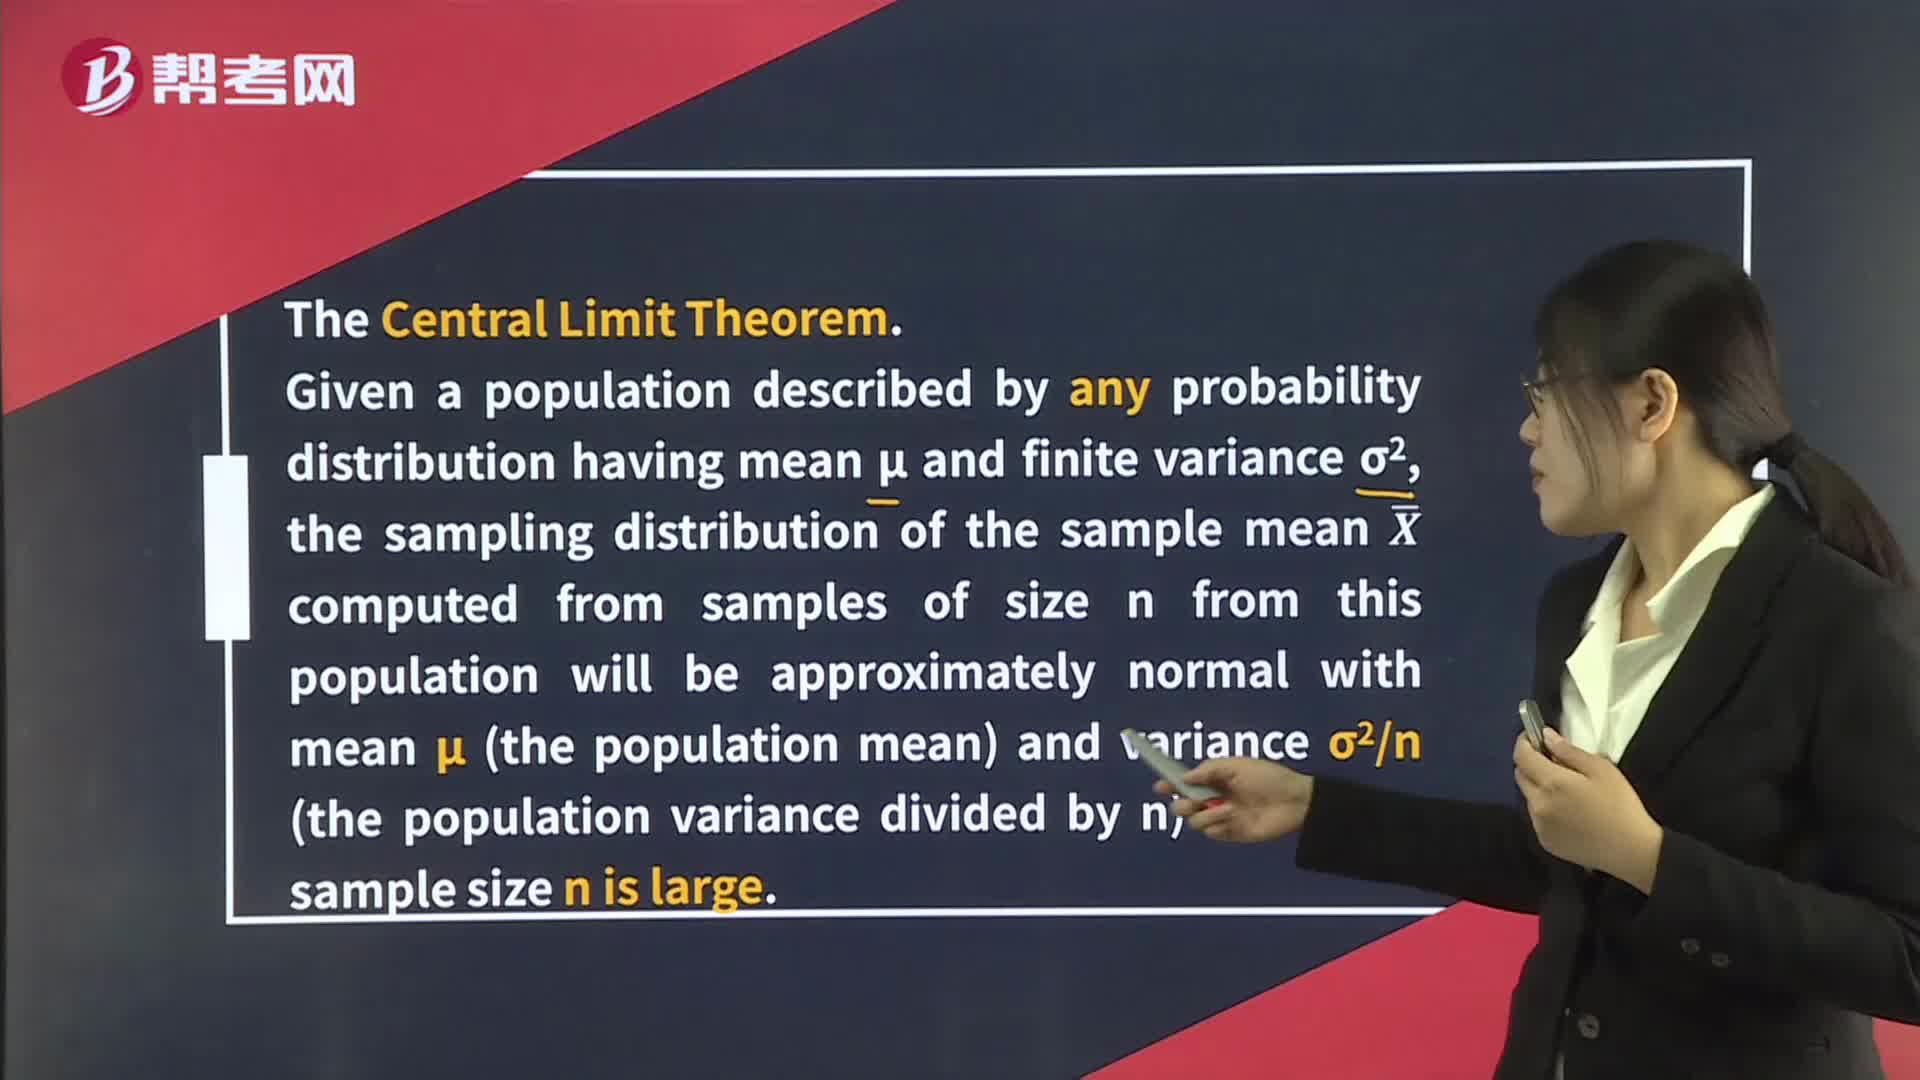
Distribution of the Sample Mean
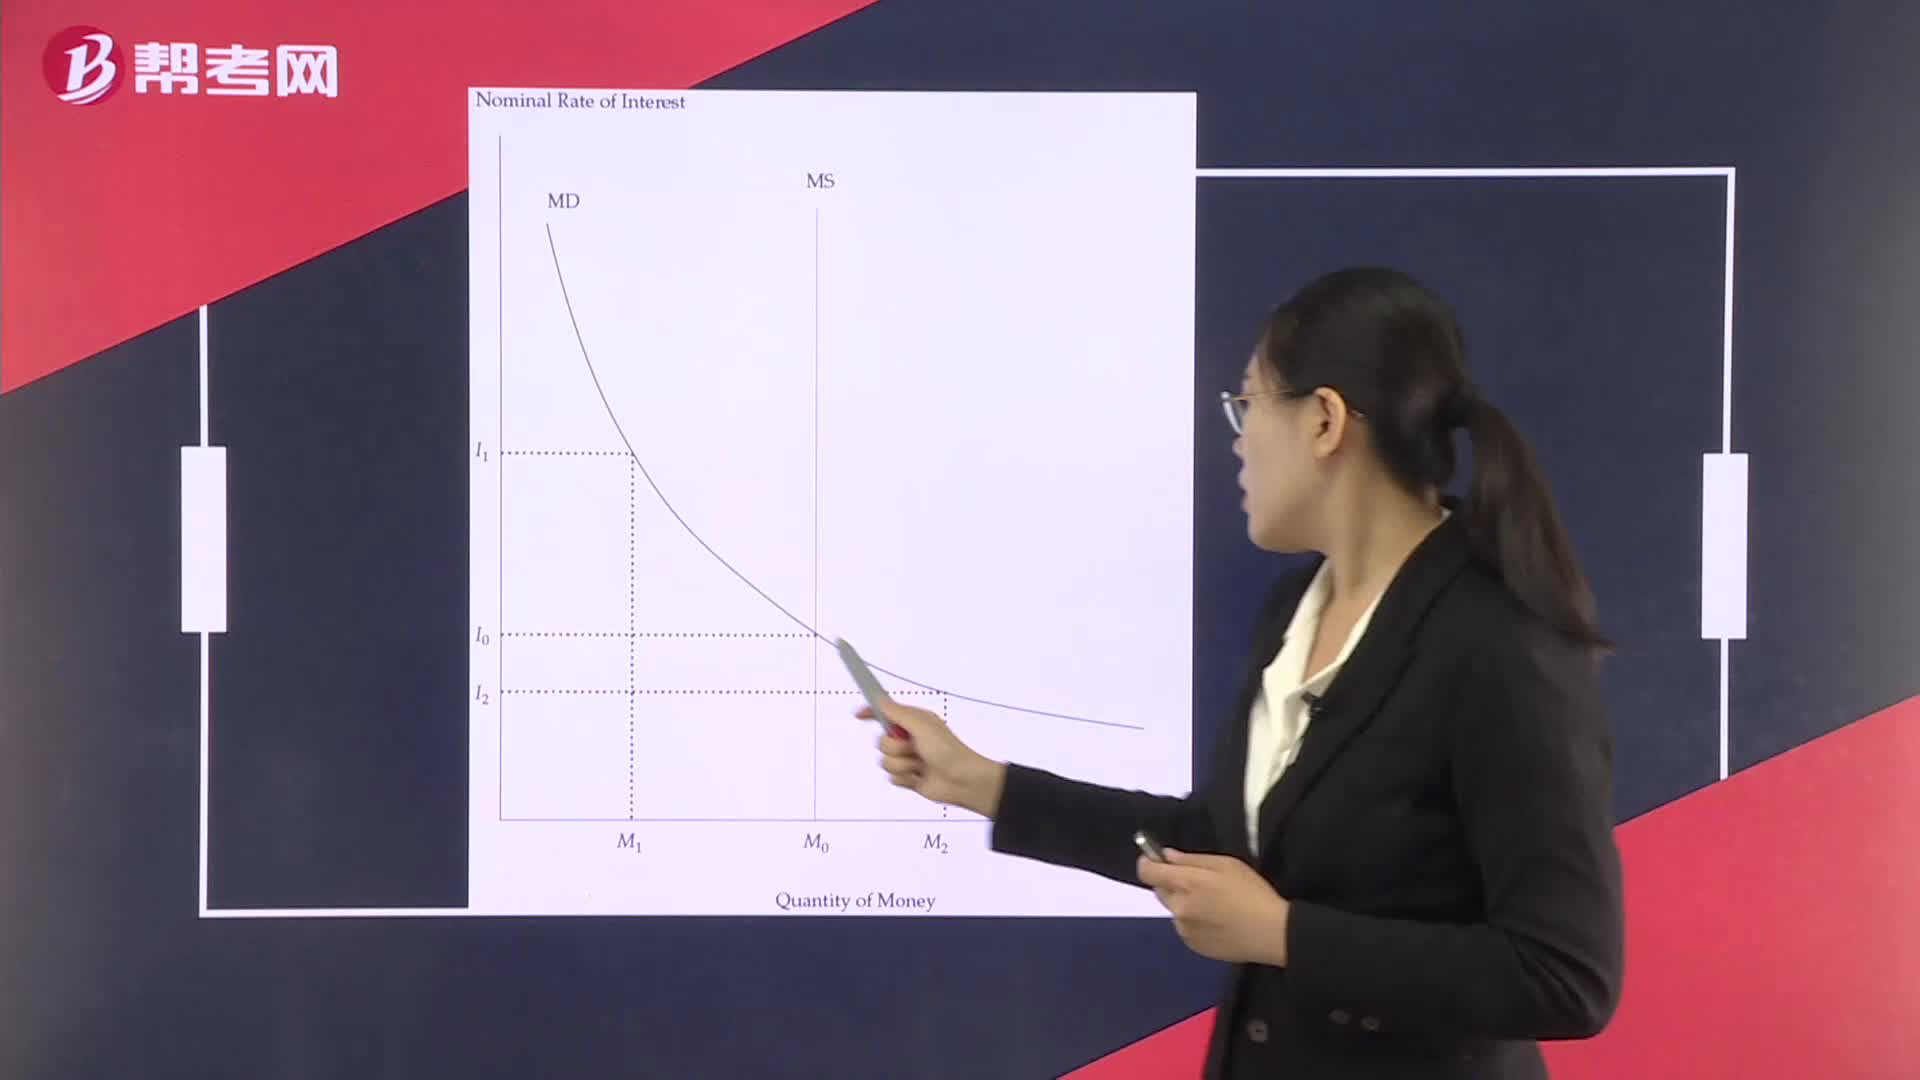
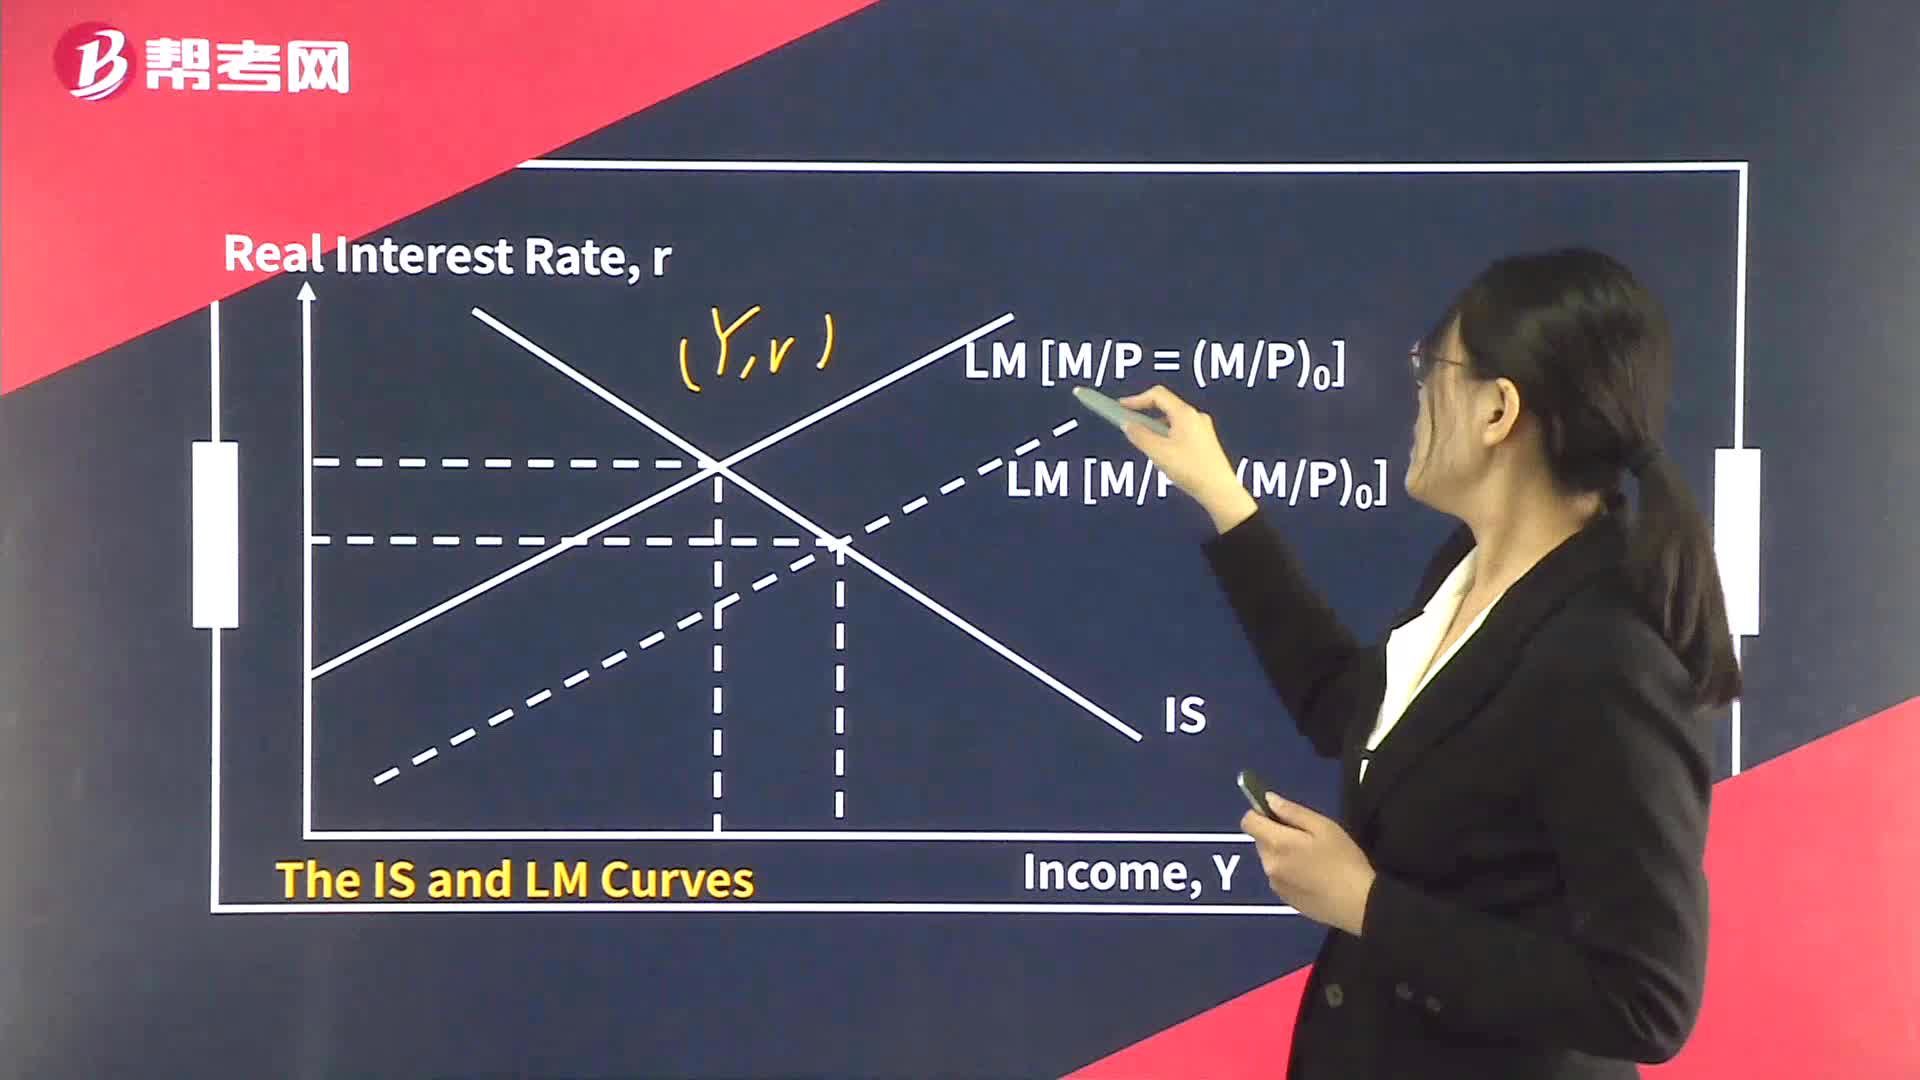
The IS Curve
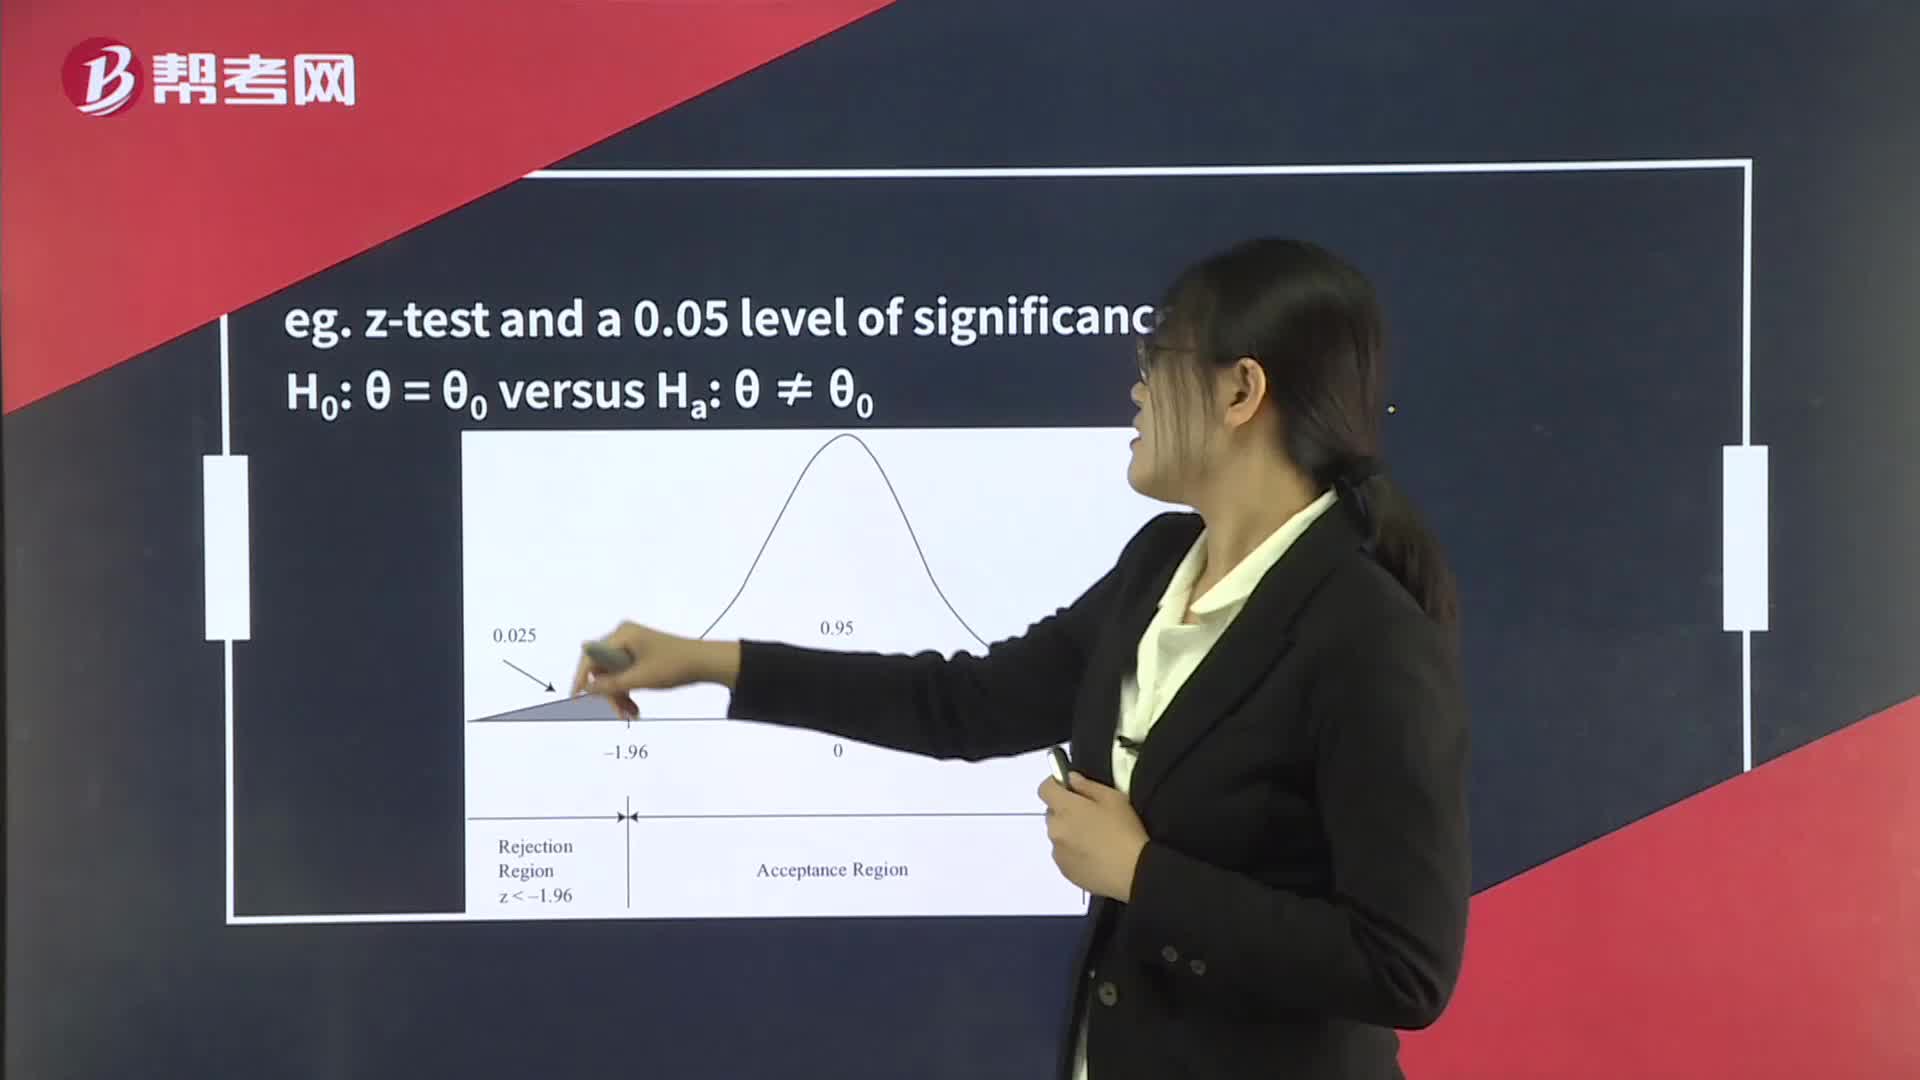
Rejection Point (Critical Value) for the Test Statistic
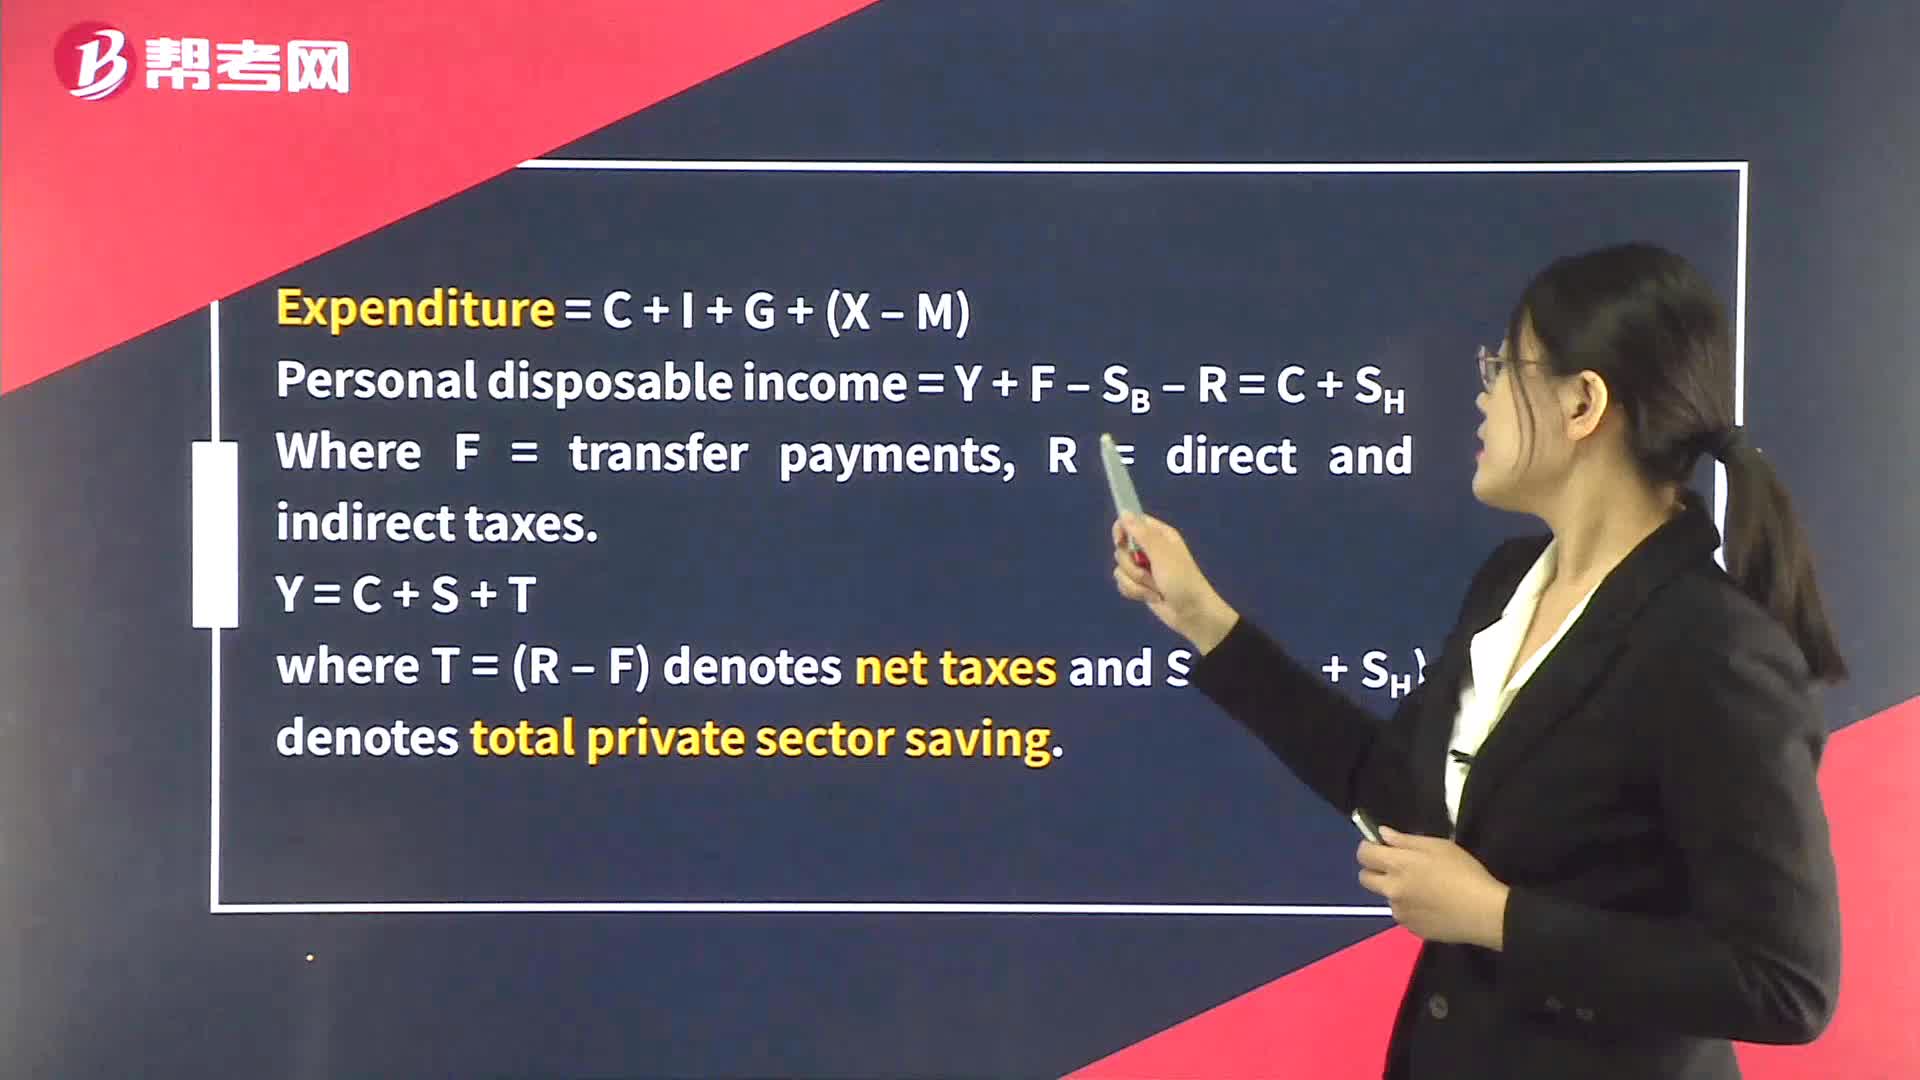
The Aggregate Demand Curve

Multiplication Rule For Expected Value
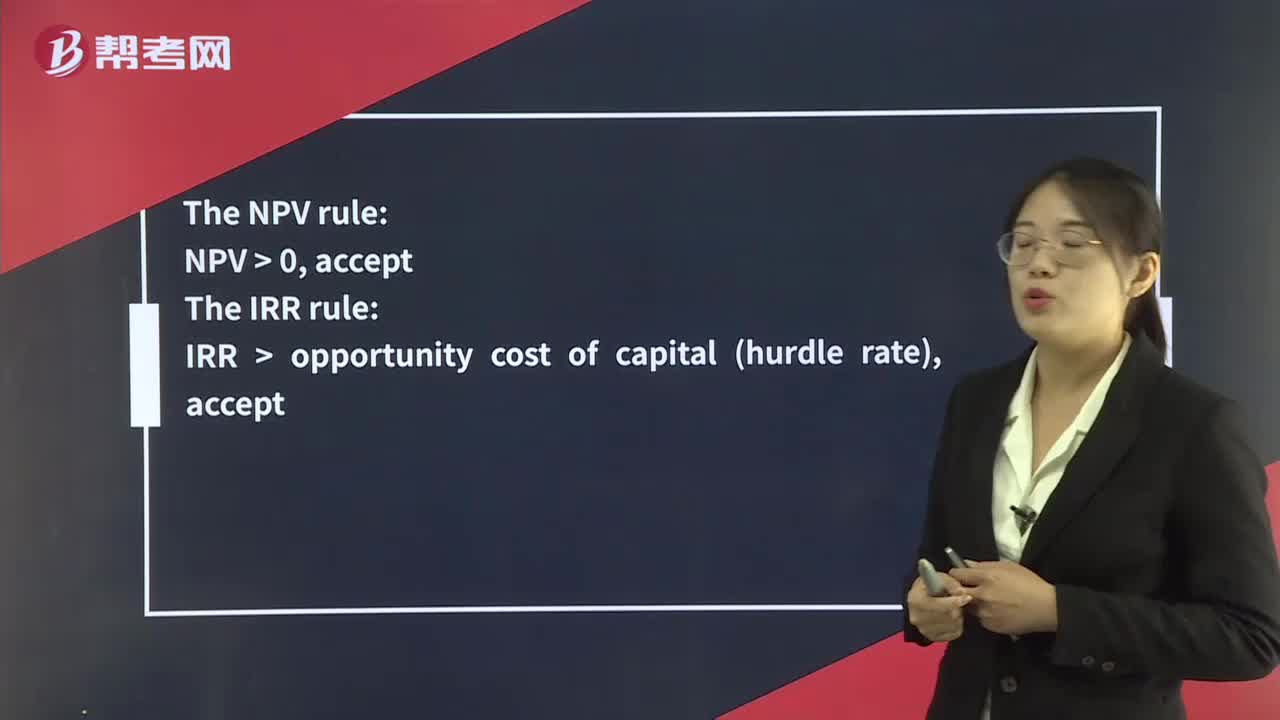
The NPV Rule & The IRR Rule

The Shutdown Decision